2023 State of Crypto Report: Introducing the State of Crypto Index
Emerging technologies evolve in cycles; in crypto, this includes periods of high activity, followed by so-called crypto winters. In the period marked by our now-annual State of Crypto report, it would be easy for a casual observer to overlook the rapid progress the crypto industry is making. Major infrastructure improvements like The Merge – a momentous achievement in decentralized and open source development – simply don’t make headlines as often as high-profile bankruptcies, busts, and flameouts.
Our 2023 report aims to address the imbalance between the noise of fleeting price movements – and the data that tracks the signals that matter, including the durable progress of web3 technology. Overall, the report reflects a healthier industry than market prices may indicate, and a steady cycle of development, product launches, and ongoing innovation.
This year, we’re also introducing something *new*: the State of Crypto Index, an interactive tool to track the health of the crypto industry from a technological, rather than financial, perspective. To offer a more accurate and nuanced measure of the state of crypto, the index represents the weighted average monthly growth of 14 industry metrics – from the number of verified smart contracts to the number of transacting wallets and more.
In other words, the index displays, in a single chart, the rate of innovation and adoption of web3. The tool is also interactive, so you can tweak the parameters to form your own views. If you uncover an interesting insight, please share your thoughts with us at @a16zcrypto on Twitter and Farcaster.
Some key takeaways:
- Blockchains have more active users, and more ways to engage. Active addresses hit an all-time high last month – 15 million – doubling over the last two years, as a growing variety of apps and services, like on-chain games, offer people new ways to engage.
- DeFi and NFT activity appear to be rising again as promising new uses and applications emerge. After a frenetic speculative period and subsequent cooldown, more people seem to be buying NFTs in recent months. Meanwhile, on decentralized exchanges, more than $100 billion traded last month, marking the third consecutive month of positive growth in trading volume.
- The number of active developers in the crypto industry has held steady. Builders drawn in by the 2020 bull run are sticking around. Almost 30K developers contributed to, or built on, crypto projects last month – steadily increasing over 60% in the last three years.
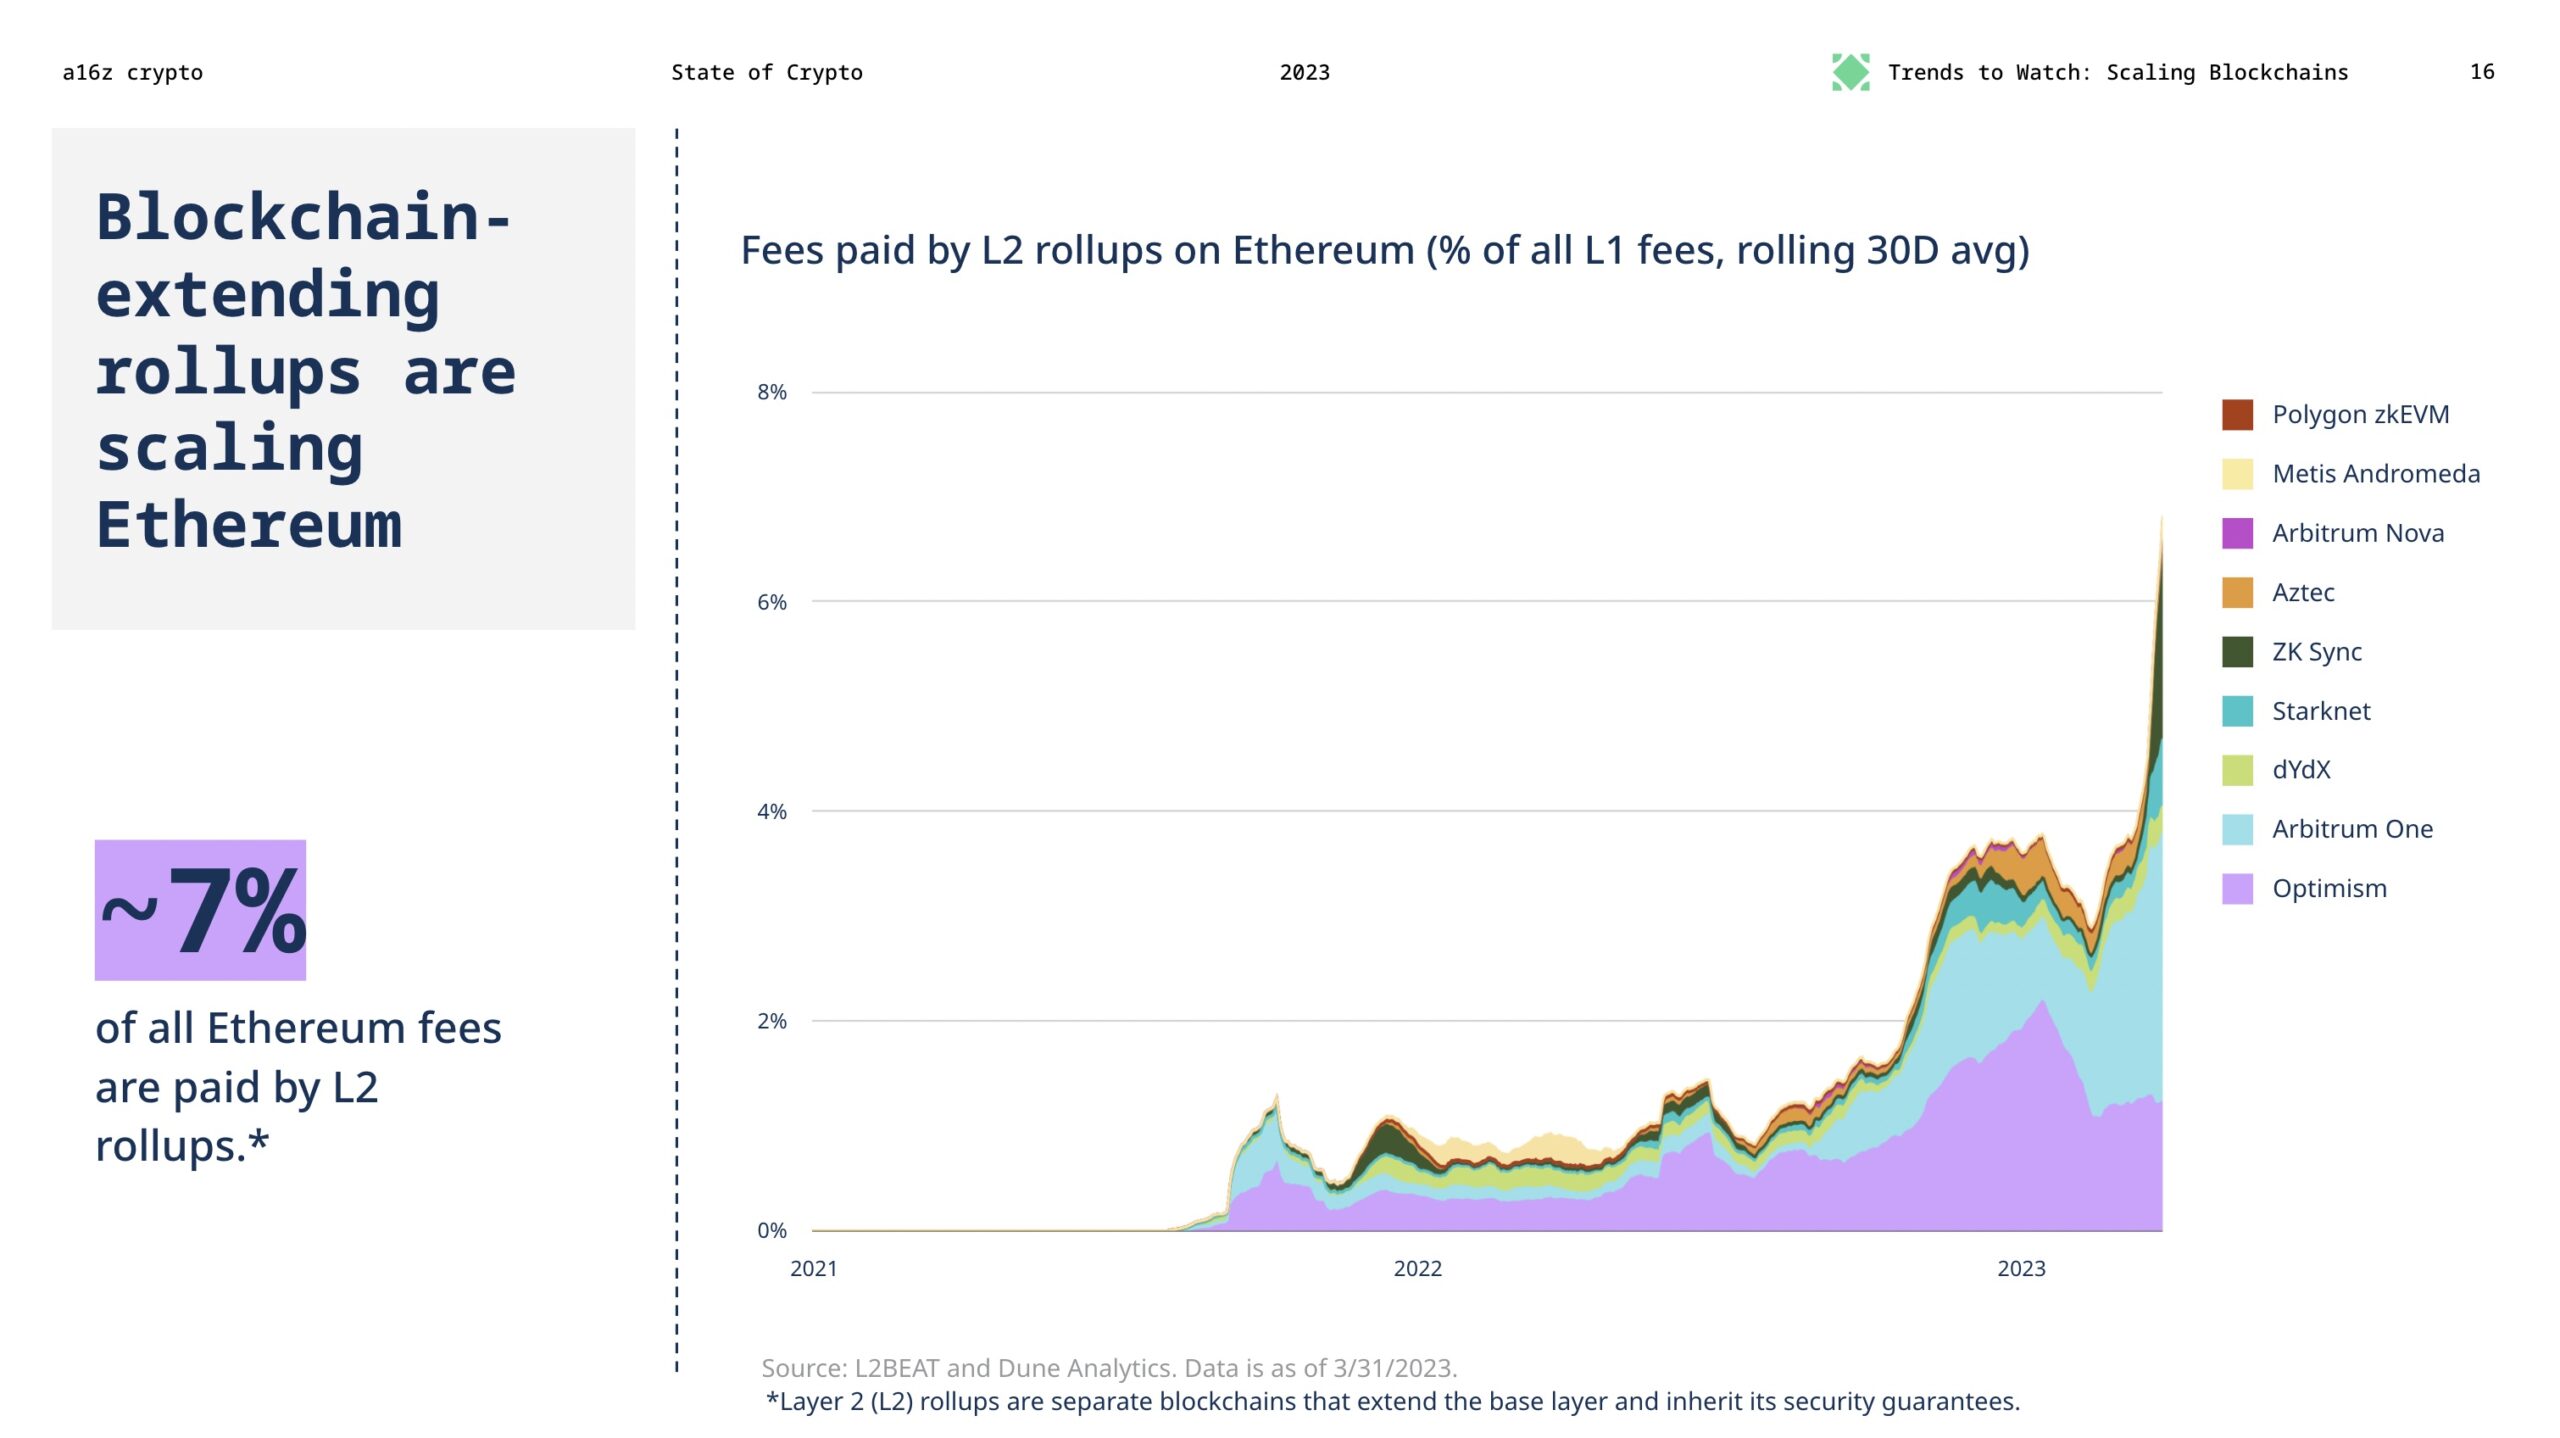
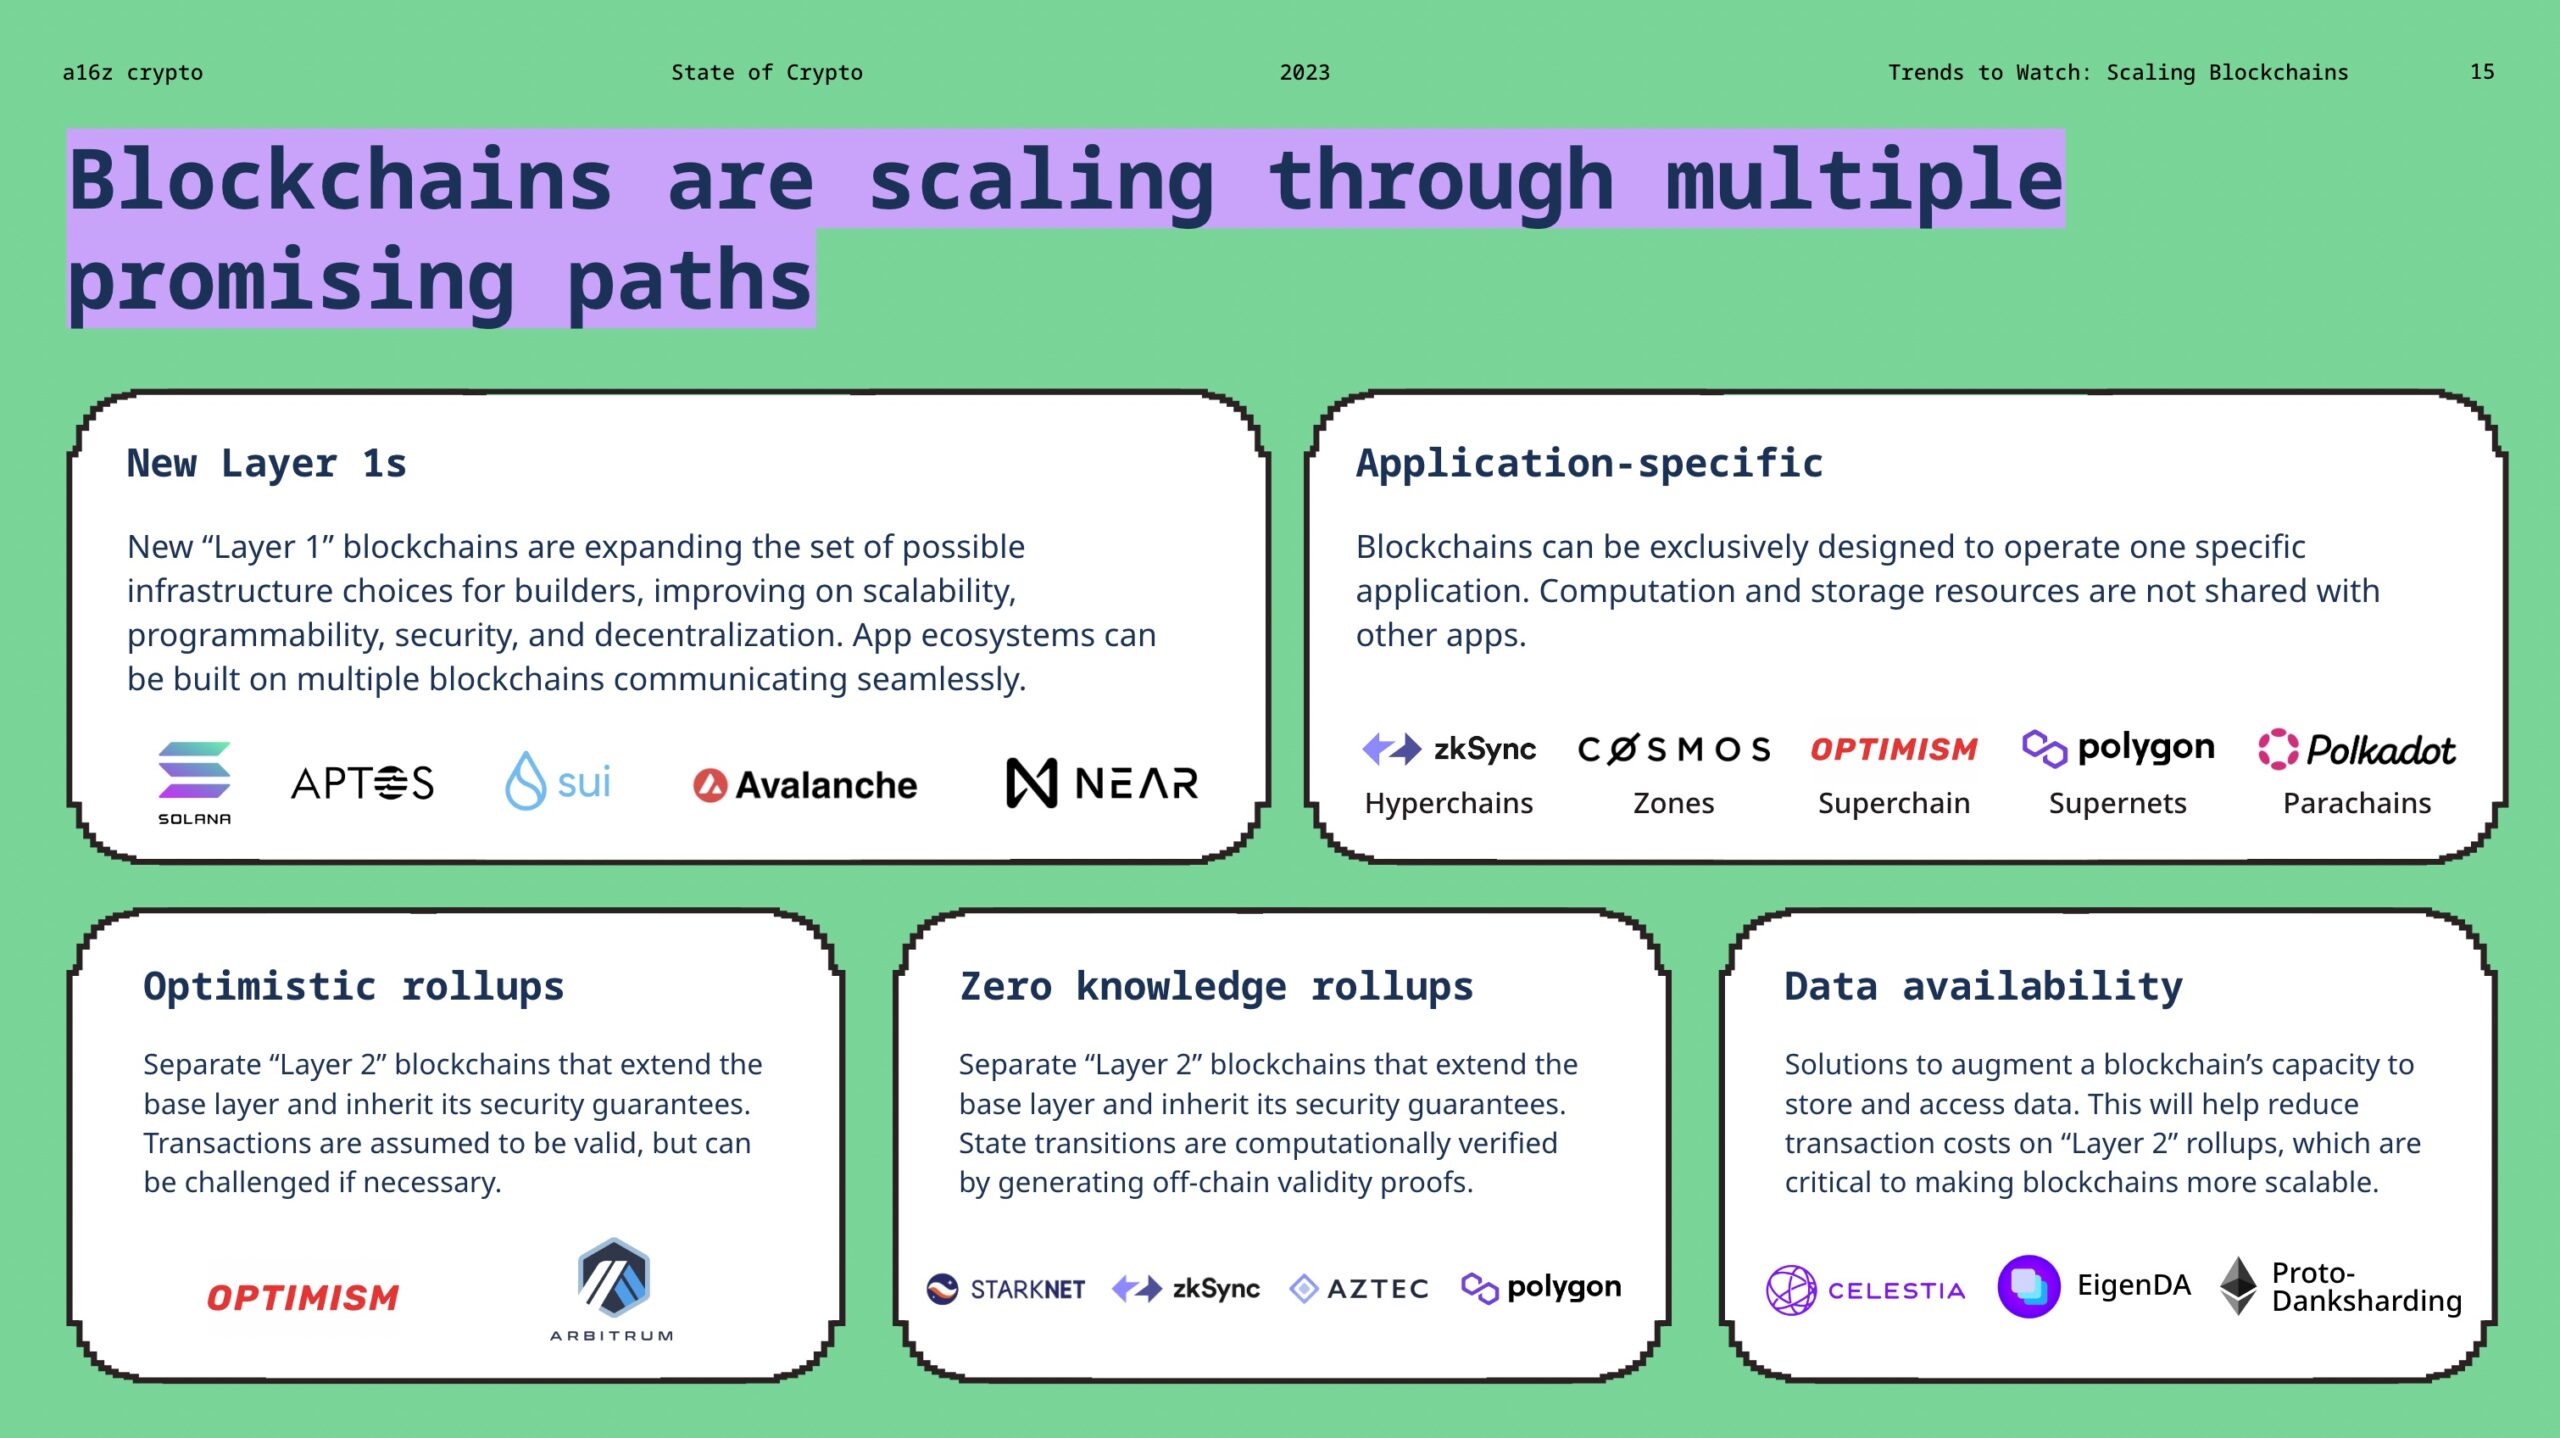
- Blockchains are scaling through promising new paths. A proliferation of protocols and projects are working to scale blockchains, facilitating more transactions using a number of different approaches and technologies. Last year, “Layer 2” (L2) scaling solutions accounted for 1.5% of the total fees paid on Ethereum. Today: 7%.
- New technologies, once practically impossible, are becoming very real. We’re seeing decades-in-the-making work on “zero knowledge” systems advance at a staggering pace, which will unlock further blockchain scalability and a new category of privacy-protecting applications (not to mention applications in AI). The data shows a positive trend in ZK-related research, developer activity, and usage.
- The U.S. is losing its lead in web3. Between 2018 and 2022, the proportion of crypto developers based in the U.S. vs. the rest of the world fell 26%. Thoughtful regulation can encourage crypto builders to innovate and grow these technologies safely in the U.S.
- Zooming out shows progress across key indicators. Market cap, developer activity, and funding activity have all increased steadily over the last decade. Stepping back from short-term volatility reveals a more predictable pattern: a price-innovation cycle where price swings propel new ideas forward.
| Want a deeper dive? |
7 takeaways from the State of Crypto 2023
1. Blockchains have more active users, and more ways to engage
Prices have steadied this year from the dizzying highs of 2021. The industry seems to be settling: speculation has cooled, and the story of how people durably, organically use and interact with web3 is starting to unfold.
We’re seeing more monthly active addresses – unique addresses transacting on-chain each month – than ever. Last month we saw 15 million sending addresses, more than twice as many as two years ago when prices were still elevated. One possible explanation: There are increasingly more ways to engage with blockchains and web3 applications. From DeFi to web3 games – more than 700 of which launched last year – a variety of new applications create addresses for their users to interact with, without having to download or connect a wallet.
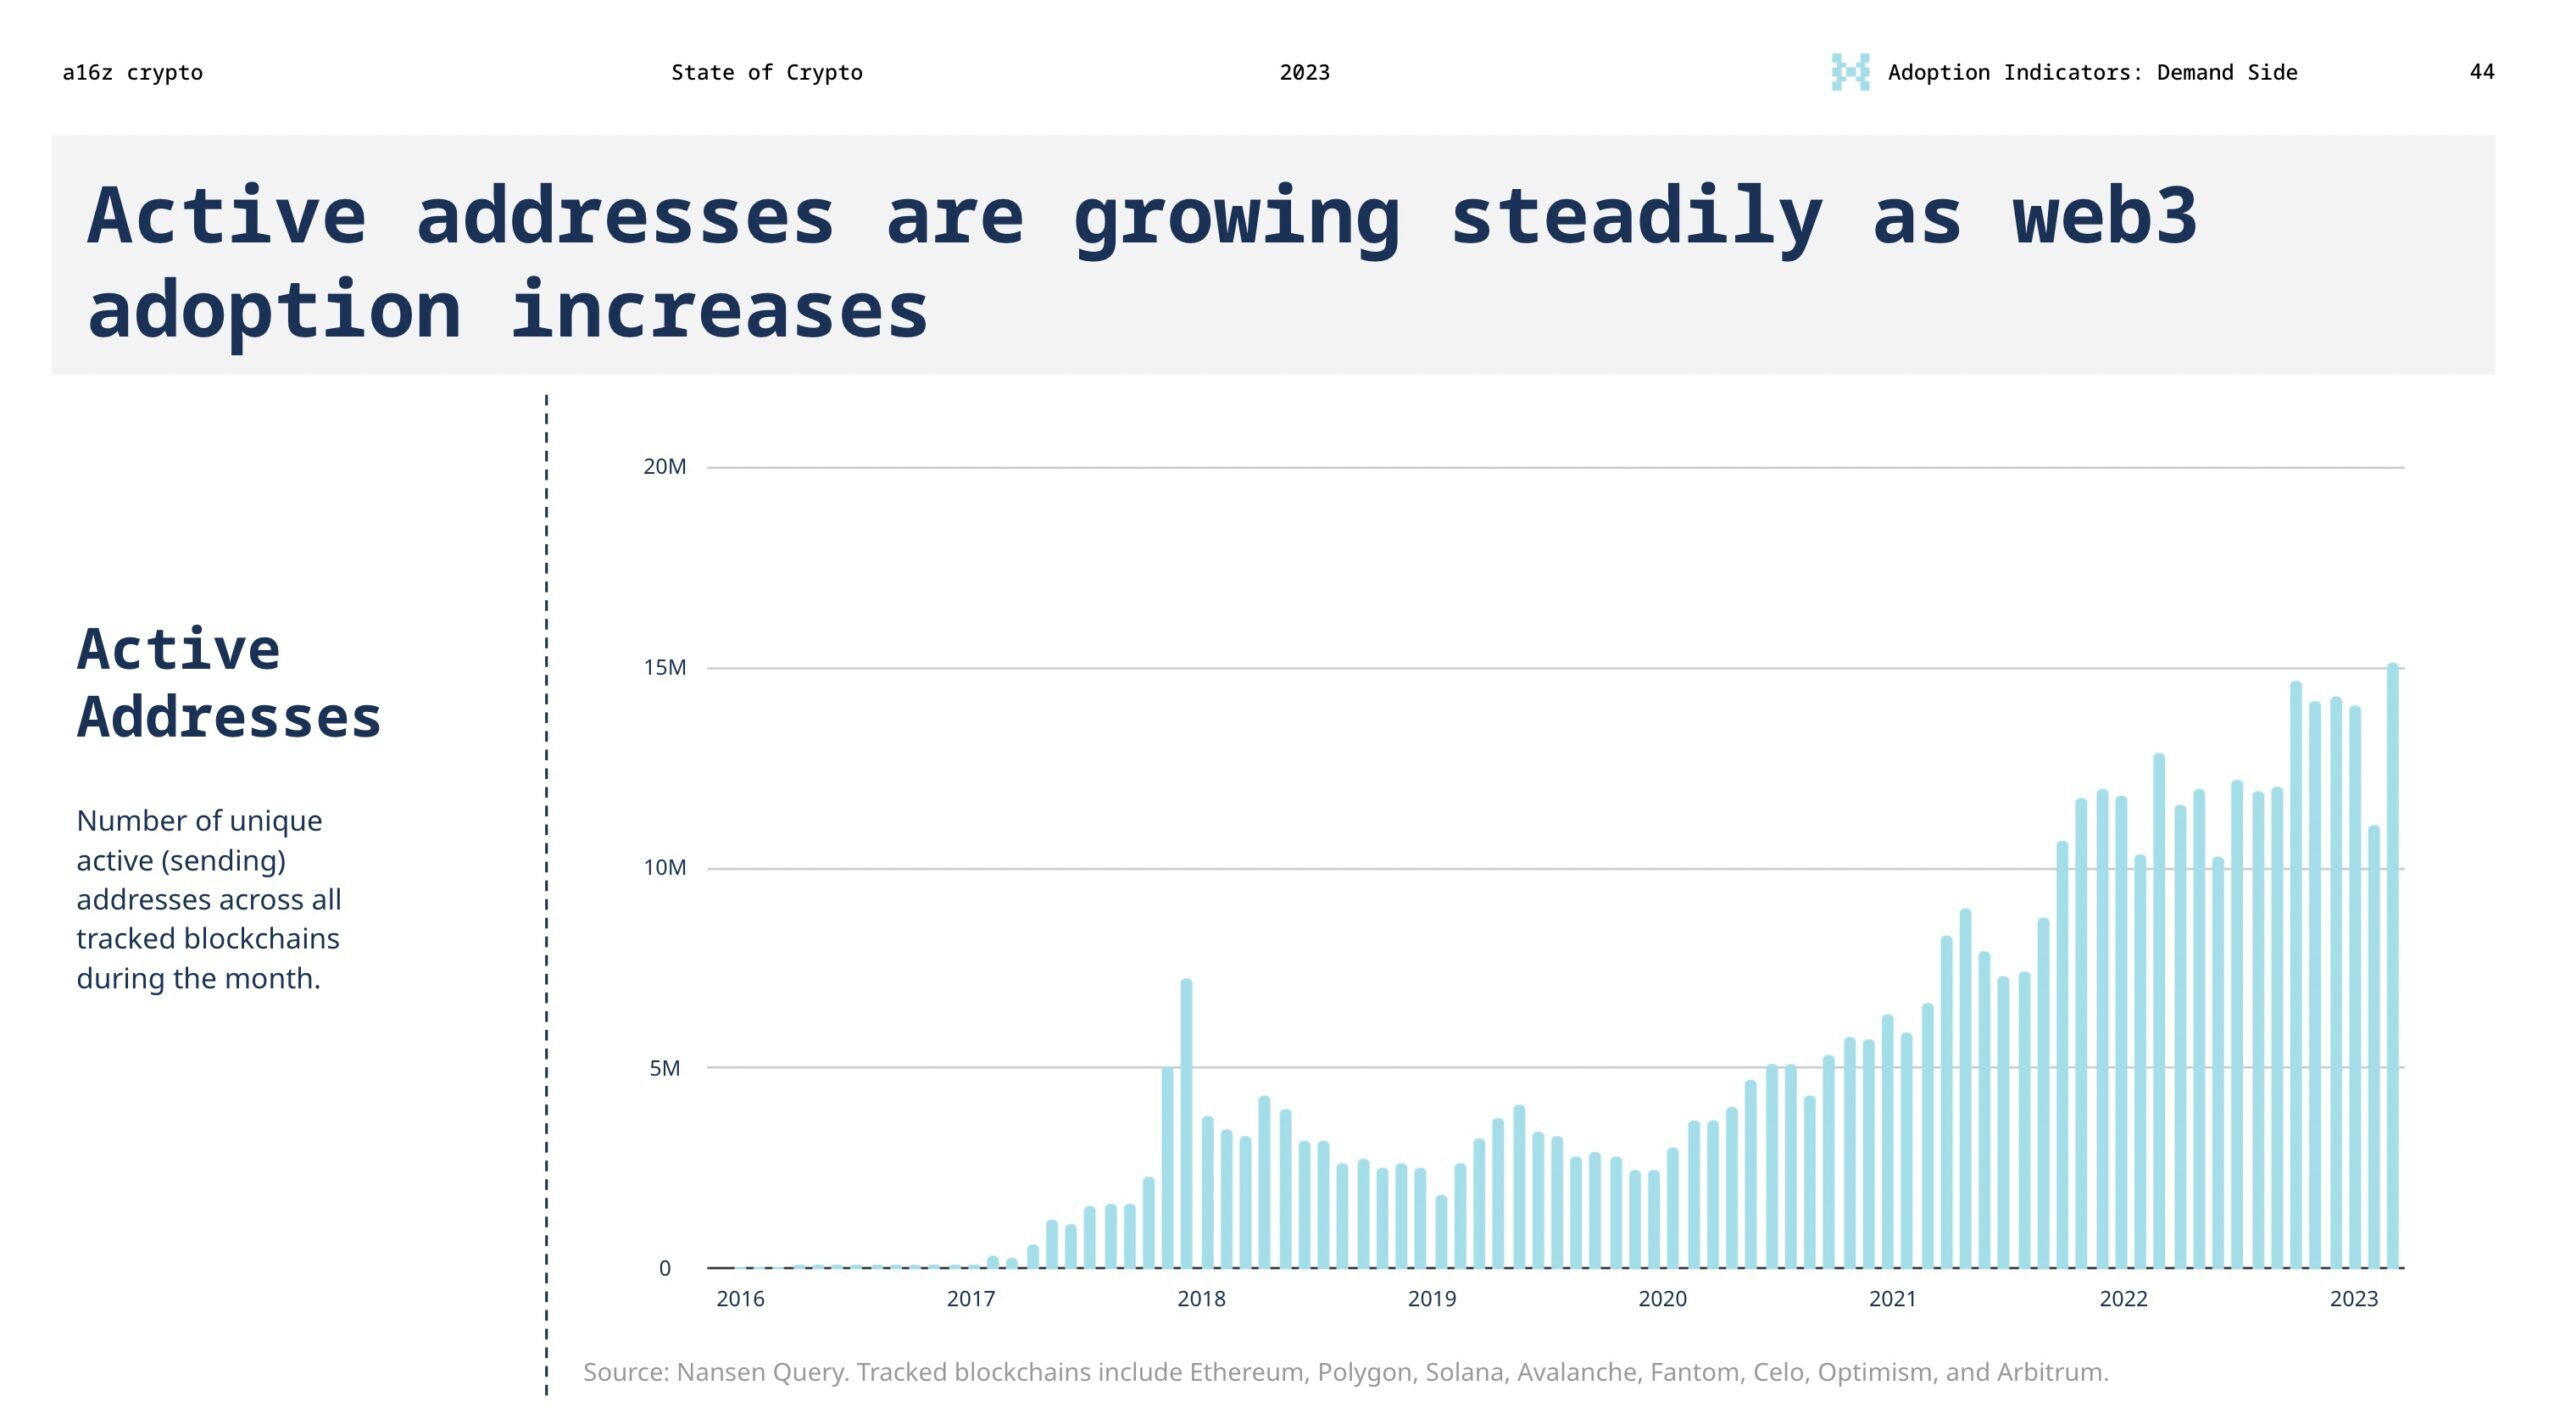
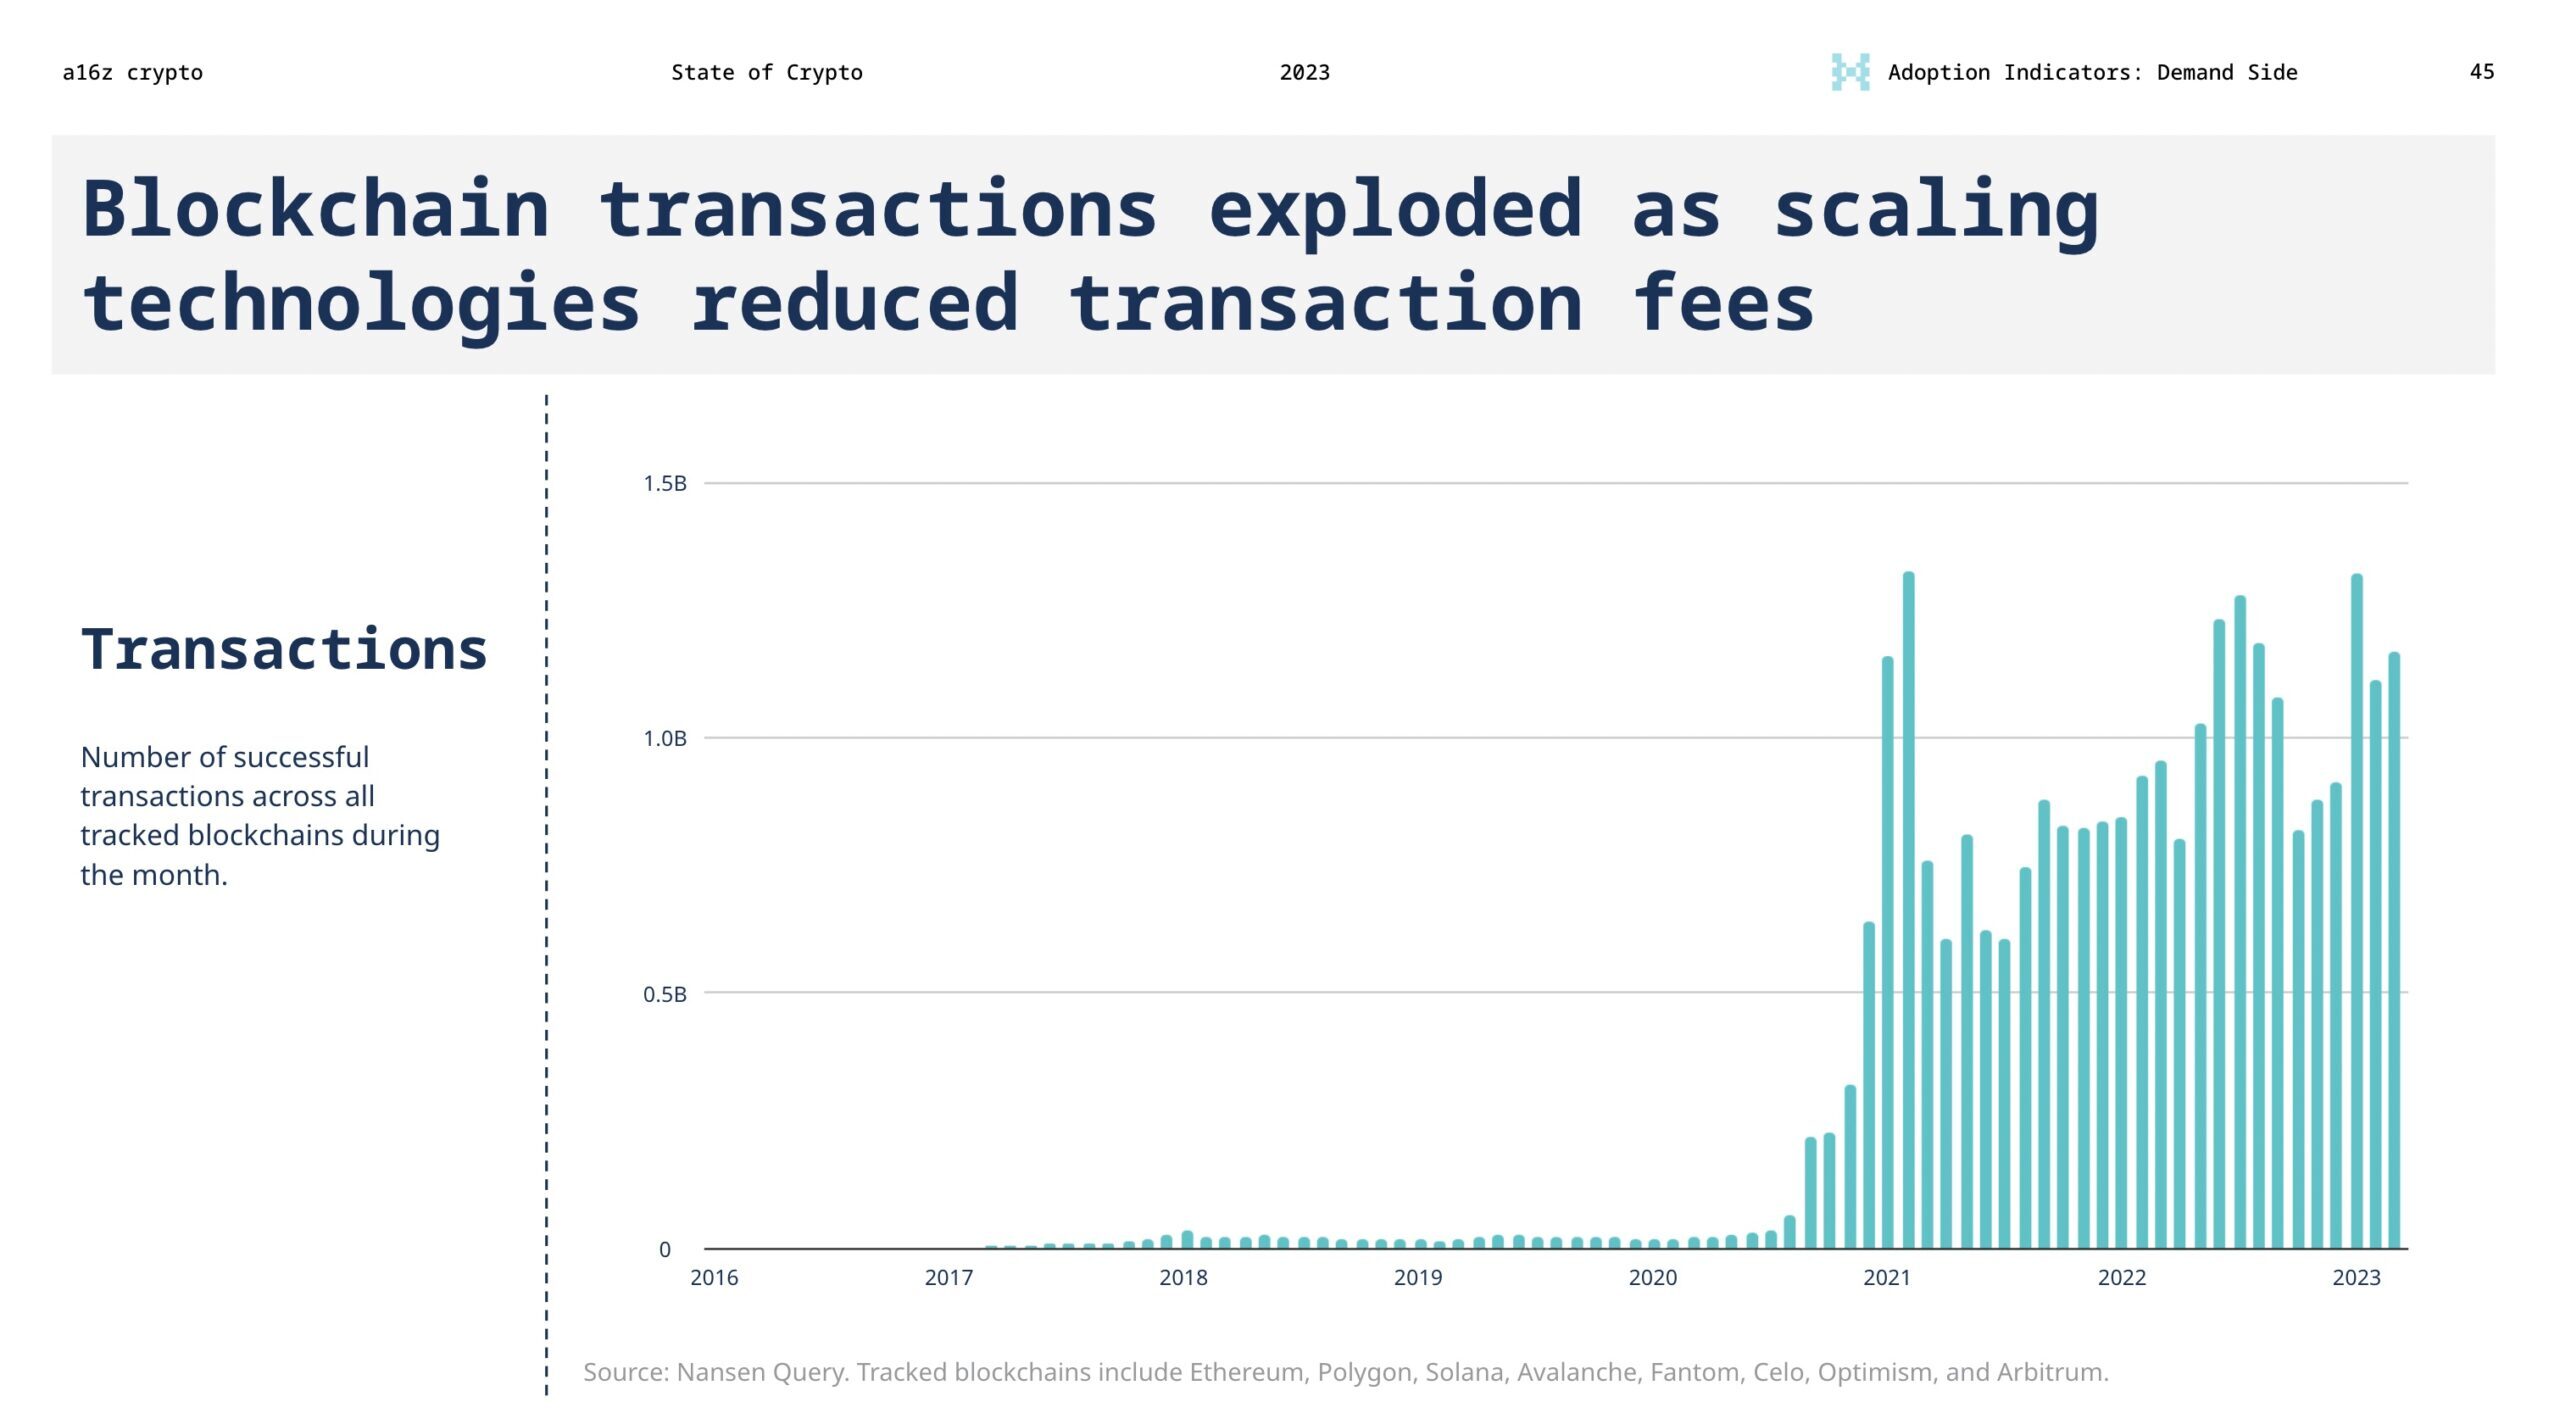
Better tooling and scaling technologies are also attracting more transactions with lower gas fees. Notably, the total number of blockchain transactions has grown by over 50% in the past two years.
2. DeFi and NFT activity appears to be rising again
Activity across DeFi and NFTs, meanwhile, seems to be on the rise again after falling from the fizzy highs of 2021. As speculation cooled, more organic uses seem to have emerged, across lending, remittances, art, collectibles, on-chain gaming, and more.
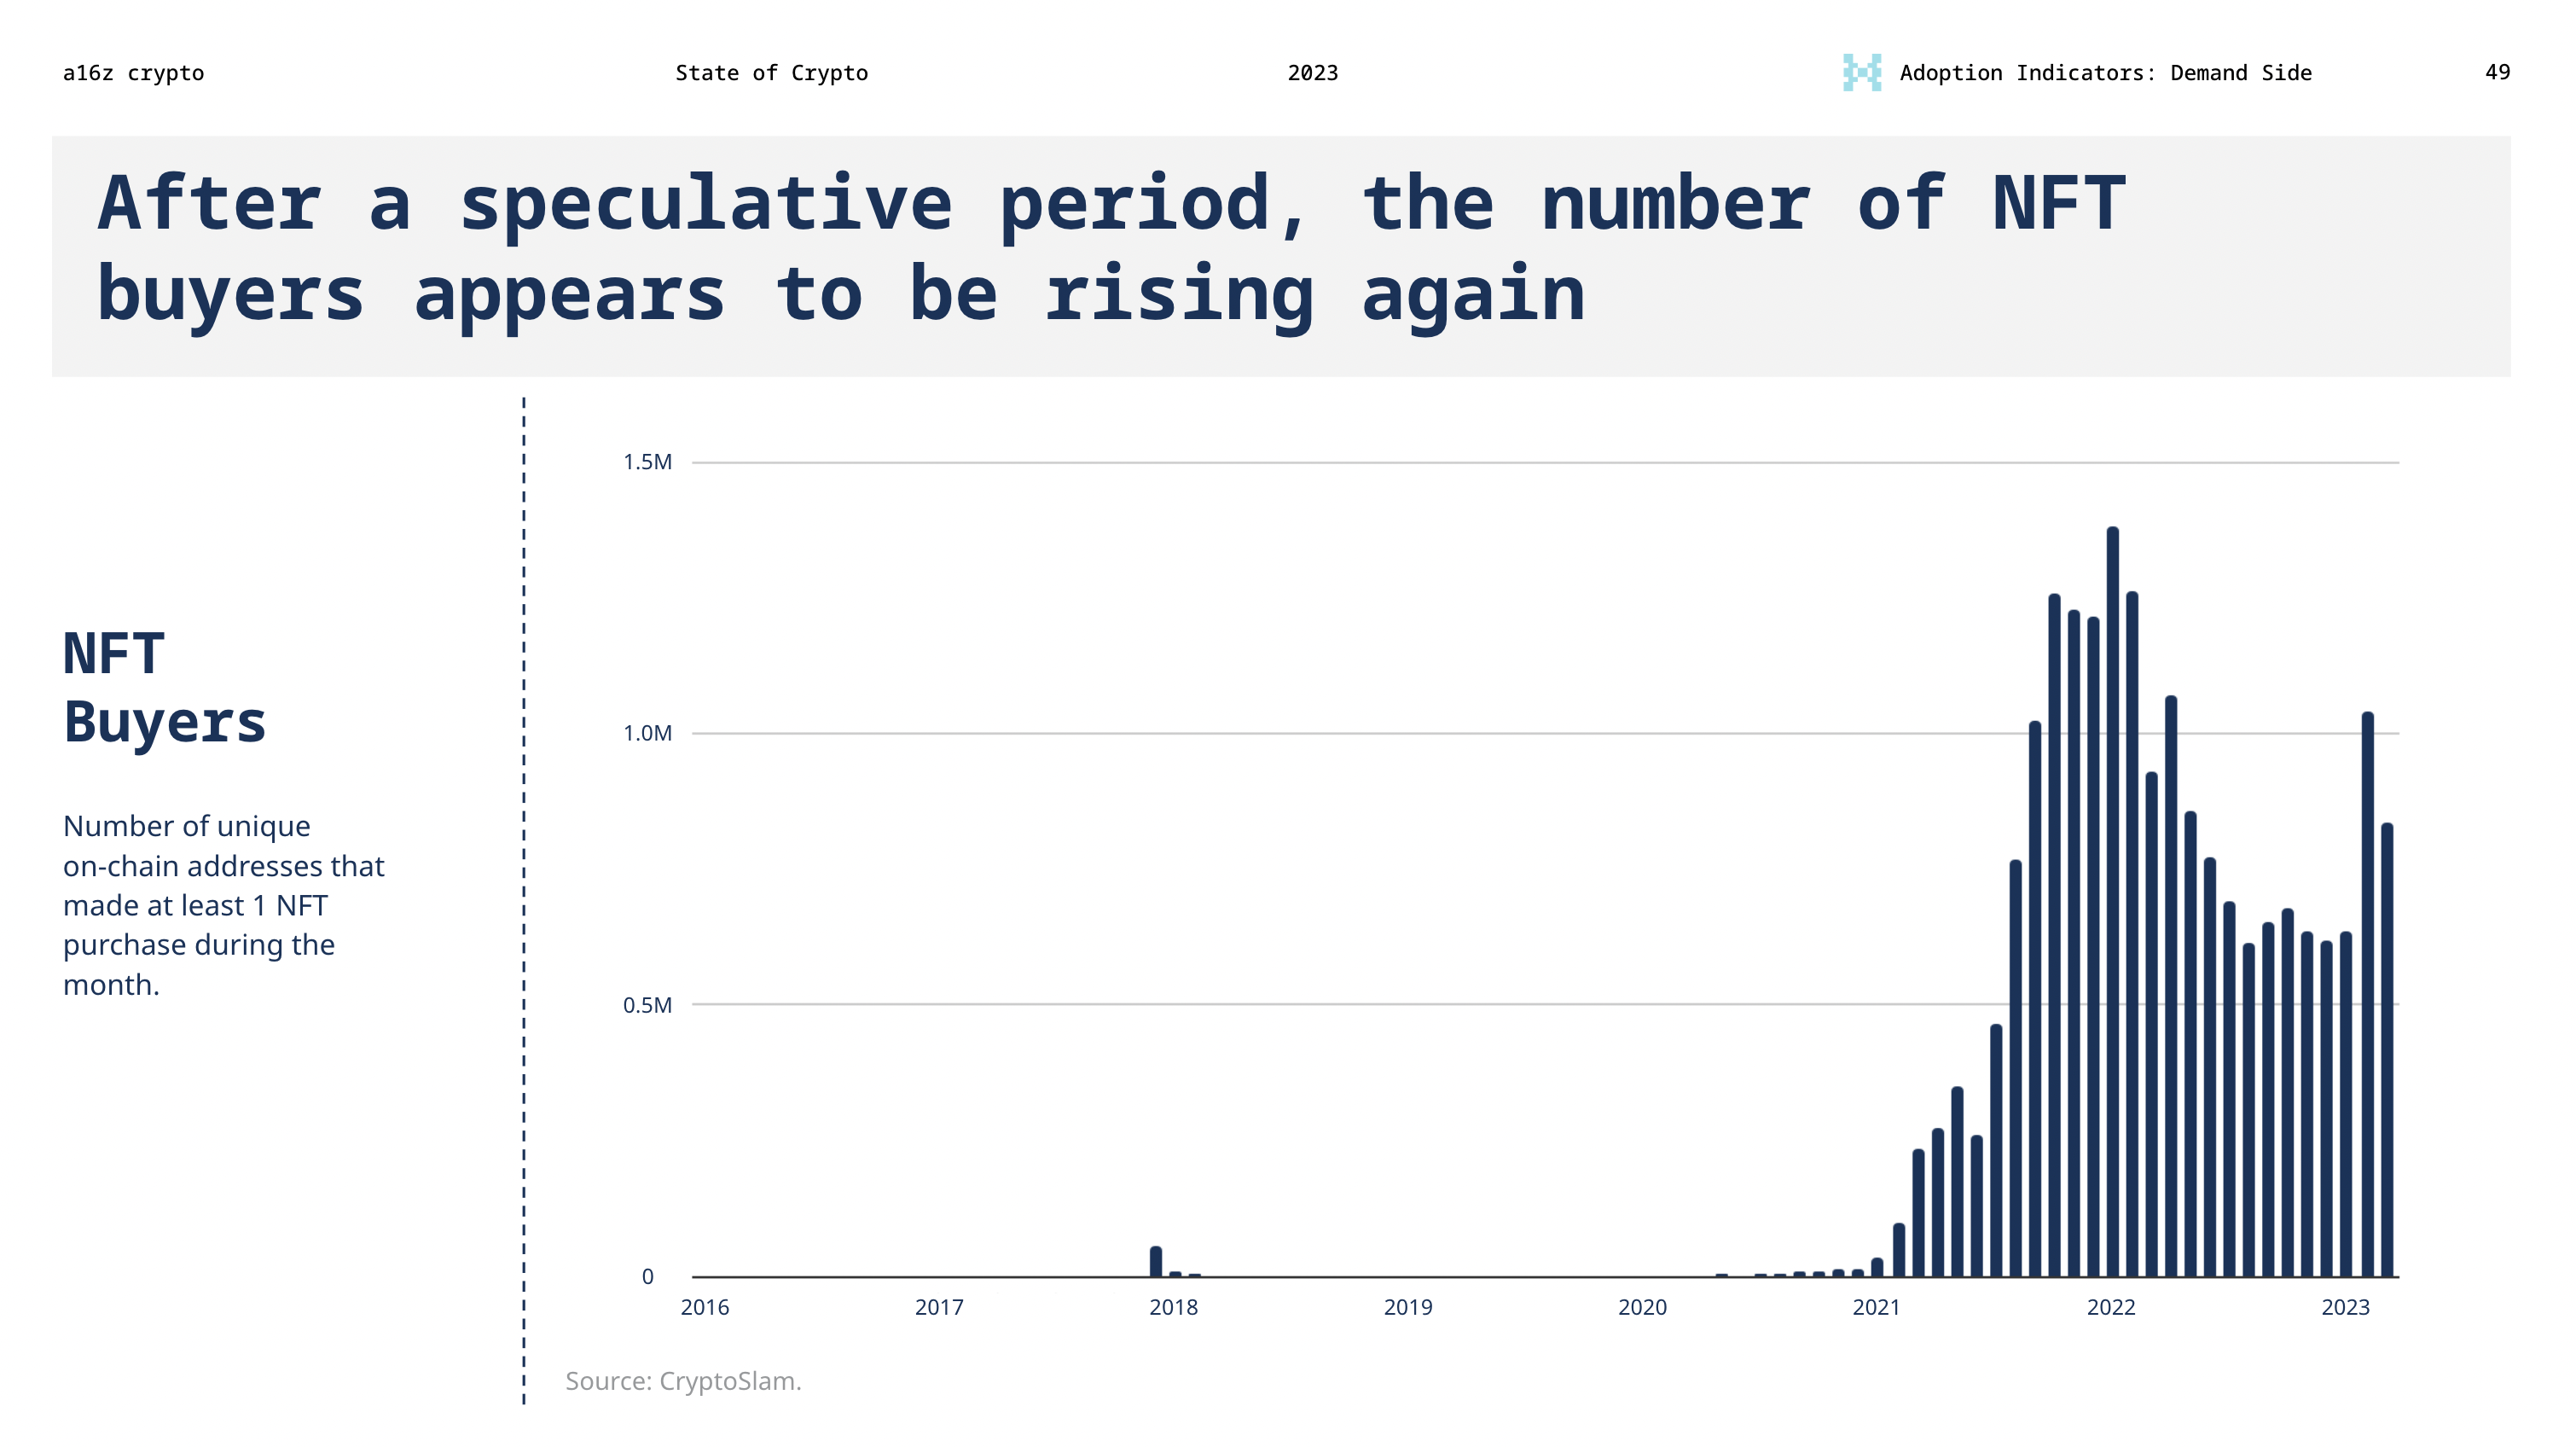
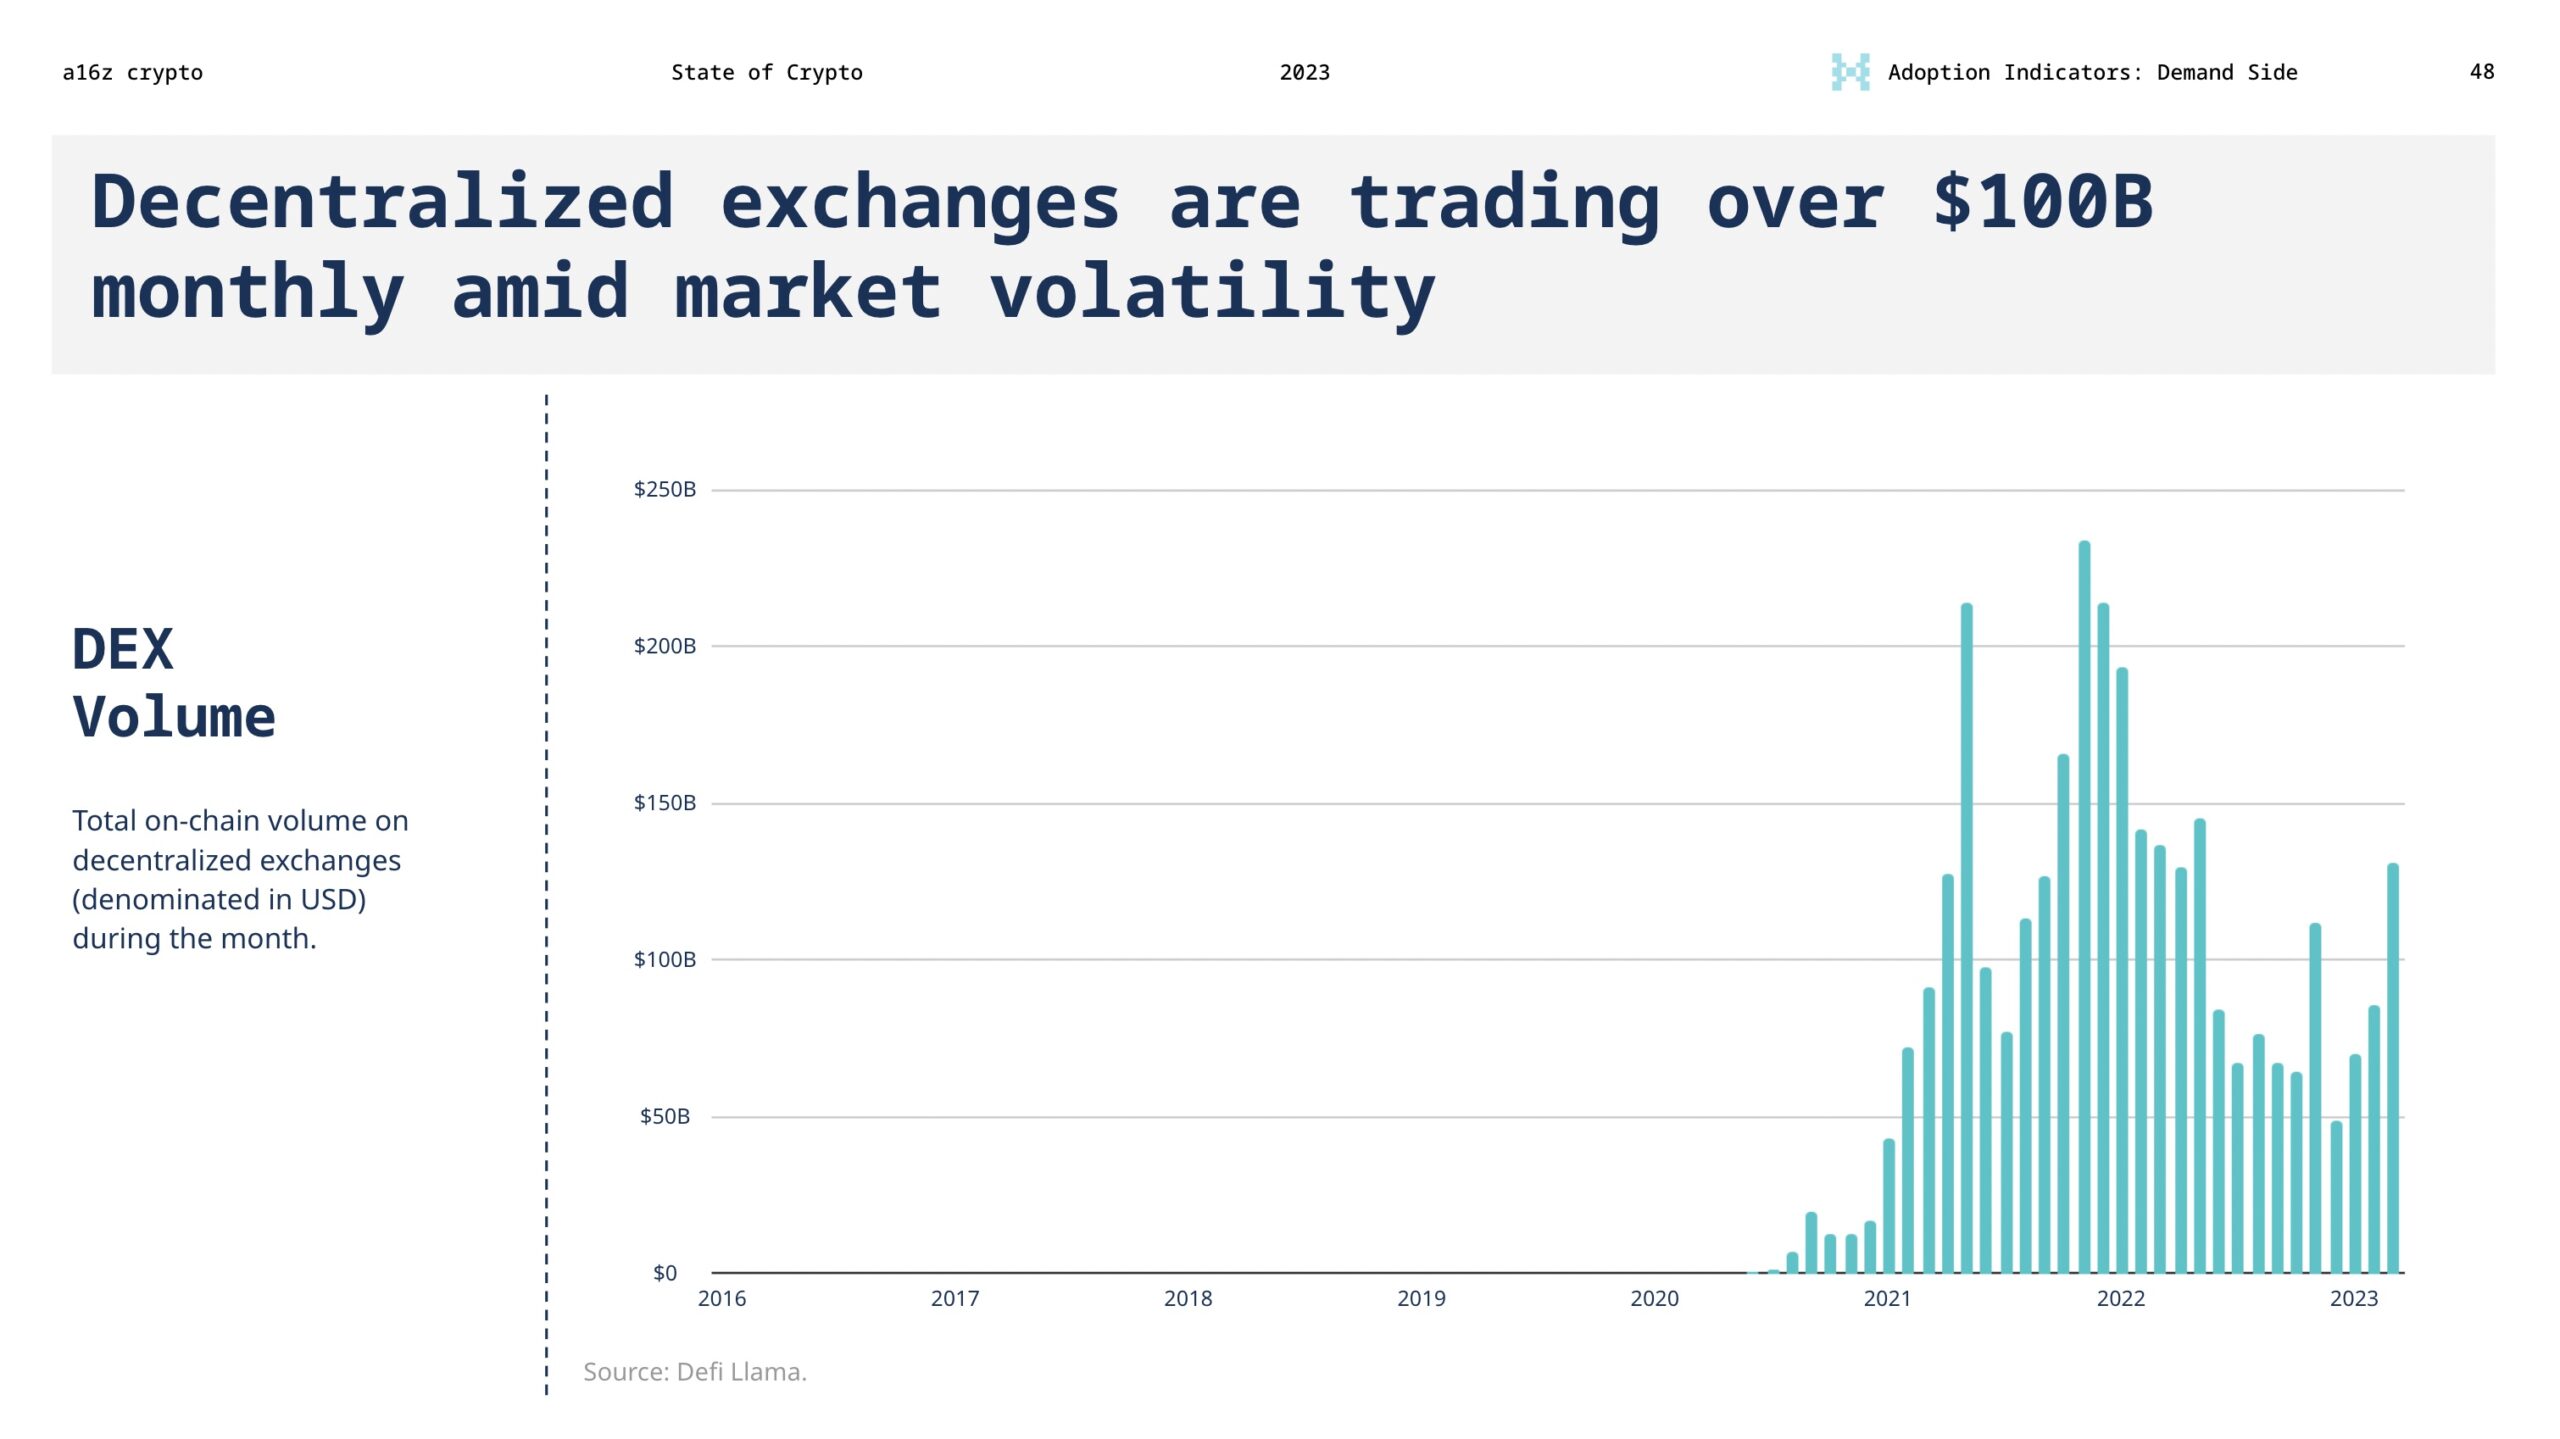
Still, the promise of NFTs and decentralized finance – to transform the economics of the internet – endures. In recent months, for example, we’ve seen an uptick in both NFT buyers and DEX volume. In fact, Uniswap – a decentralized exchange – has seen higher trading volume than Coinbase – the largest centralized exchange in the U.S. – for the last two consecutive months.
Users and creators benefit from web3’s structurally lower “take rates” (that is, the share of revenue that platform owners take from users). In crypto, users genuinely own their digital goods and can, importantly, bring these goods to any platform they please.
The easier it is for people to switch platforms, the more competition can heat up, and the less platforms can extract from users (or suddenly change the rules on them). Low platform pricing power often leads to lower take rates.
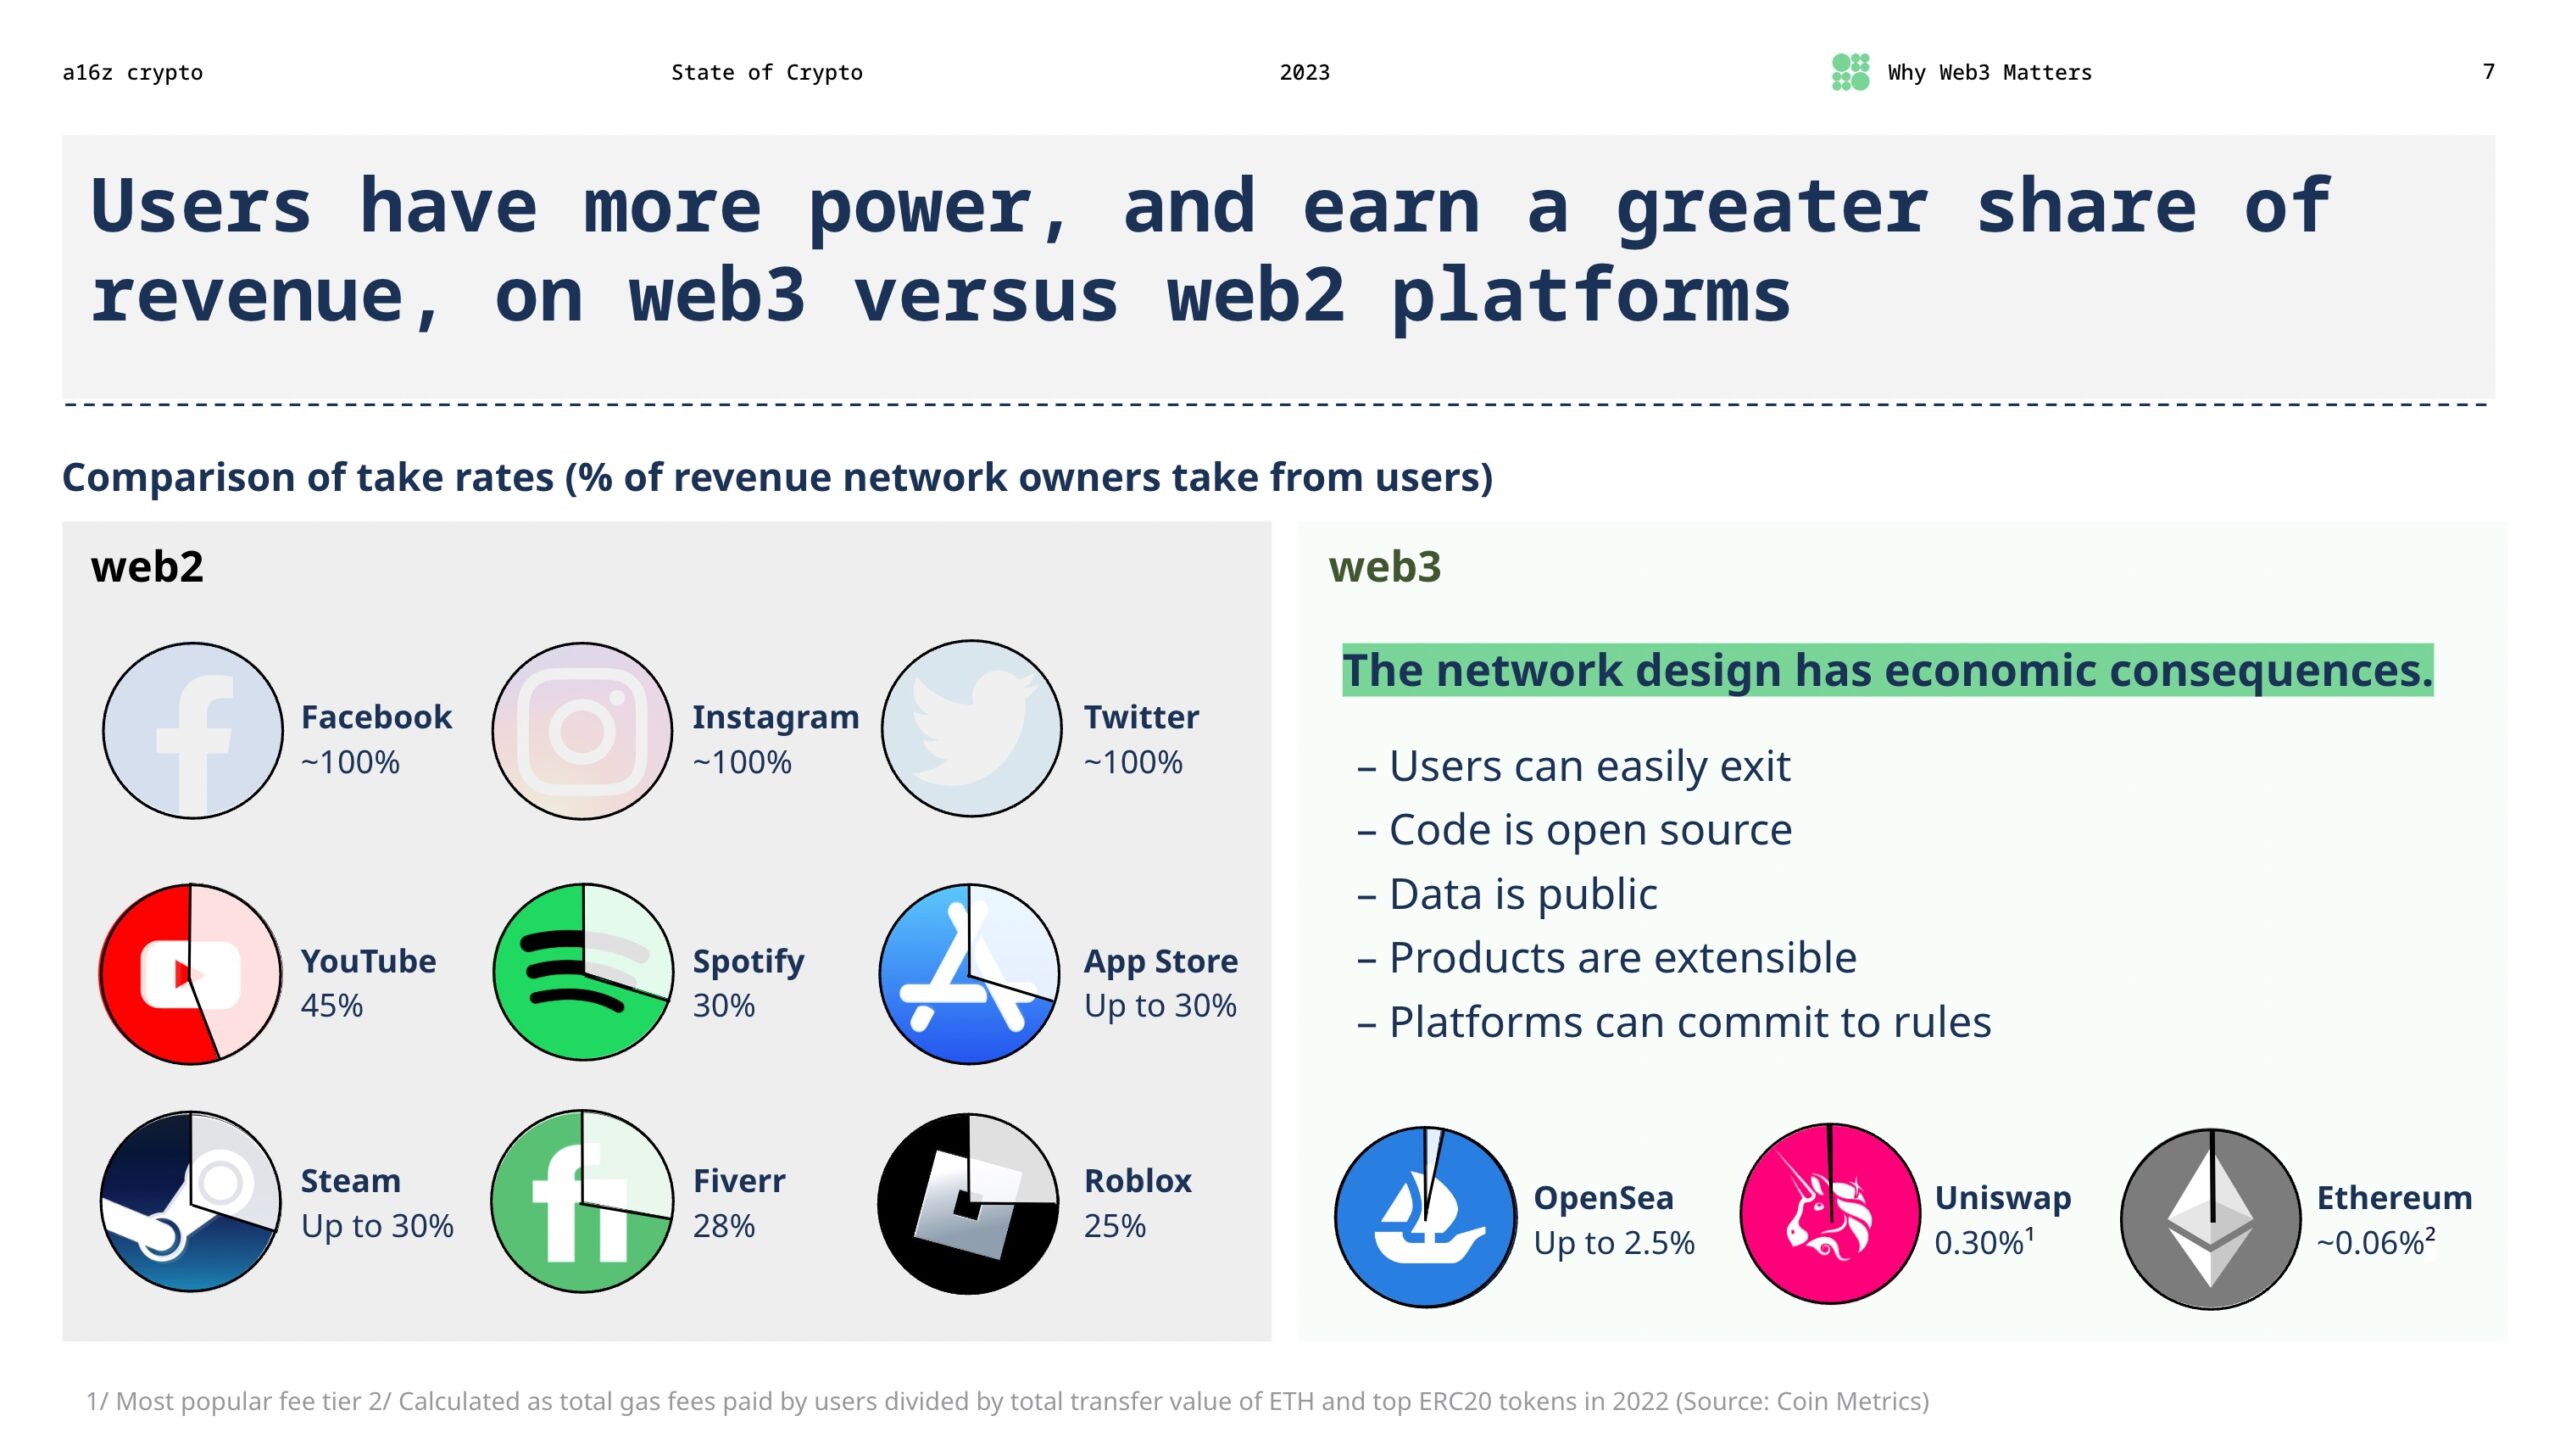
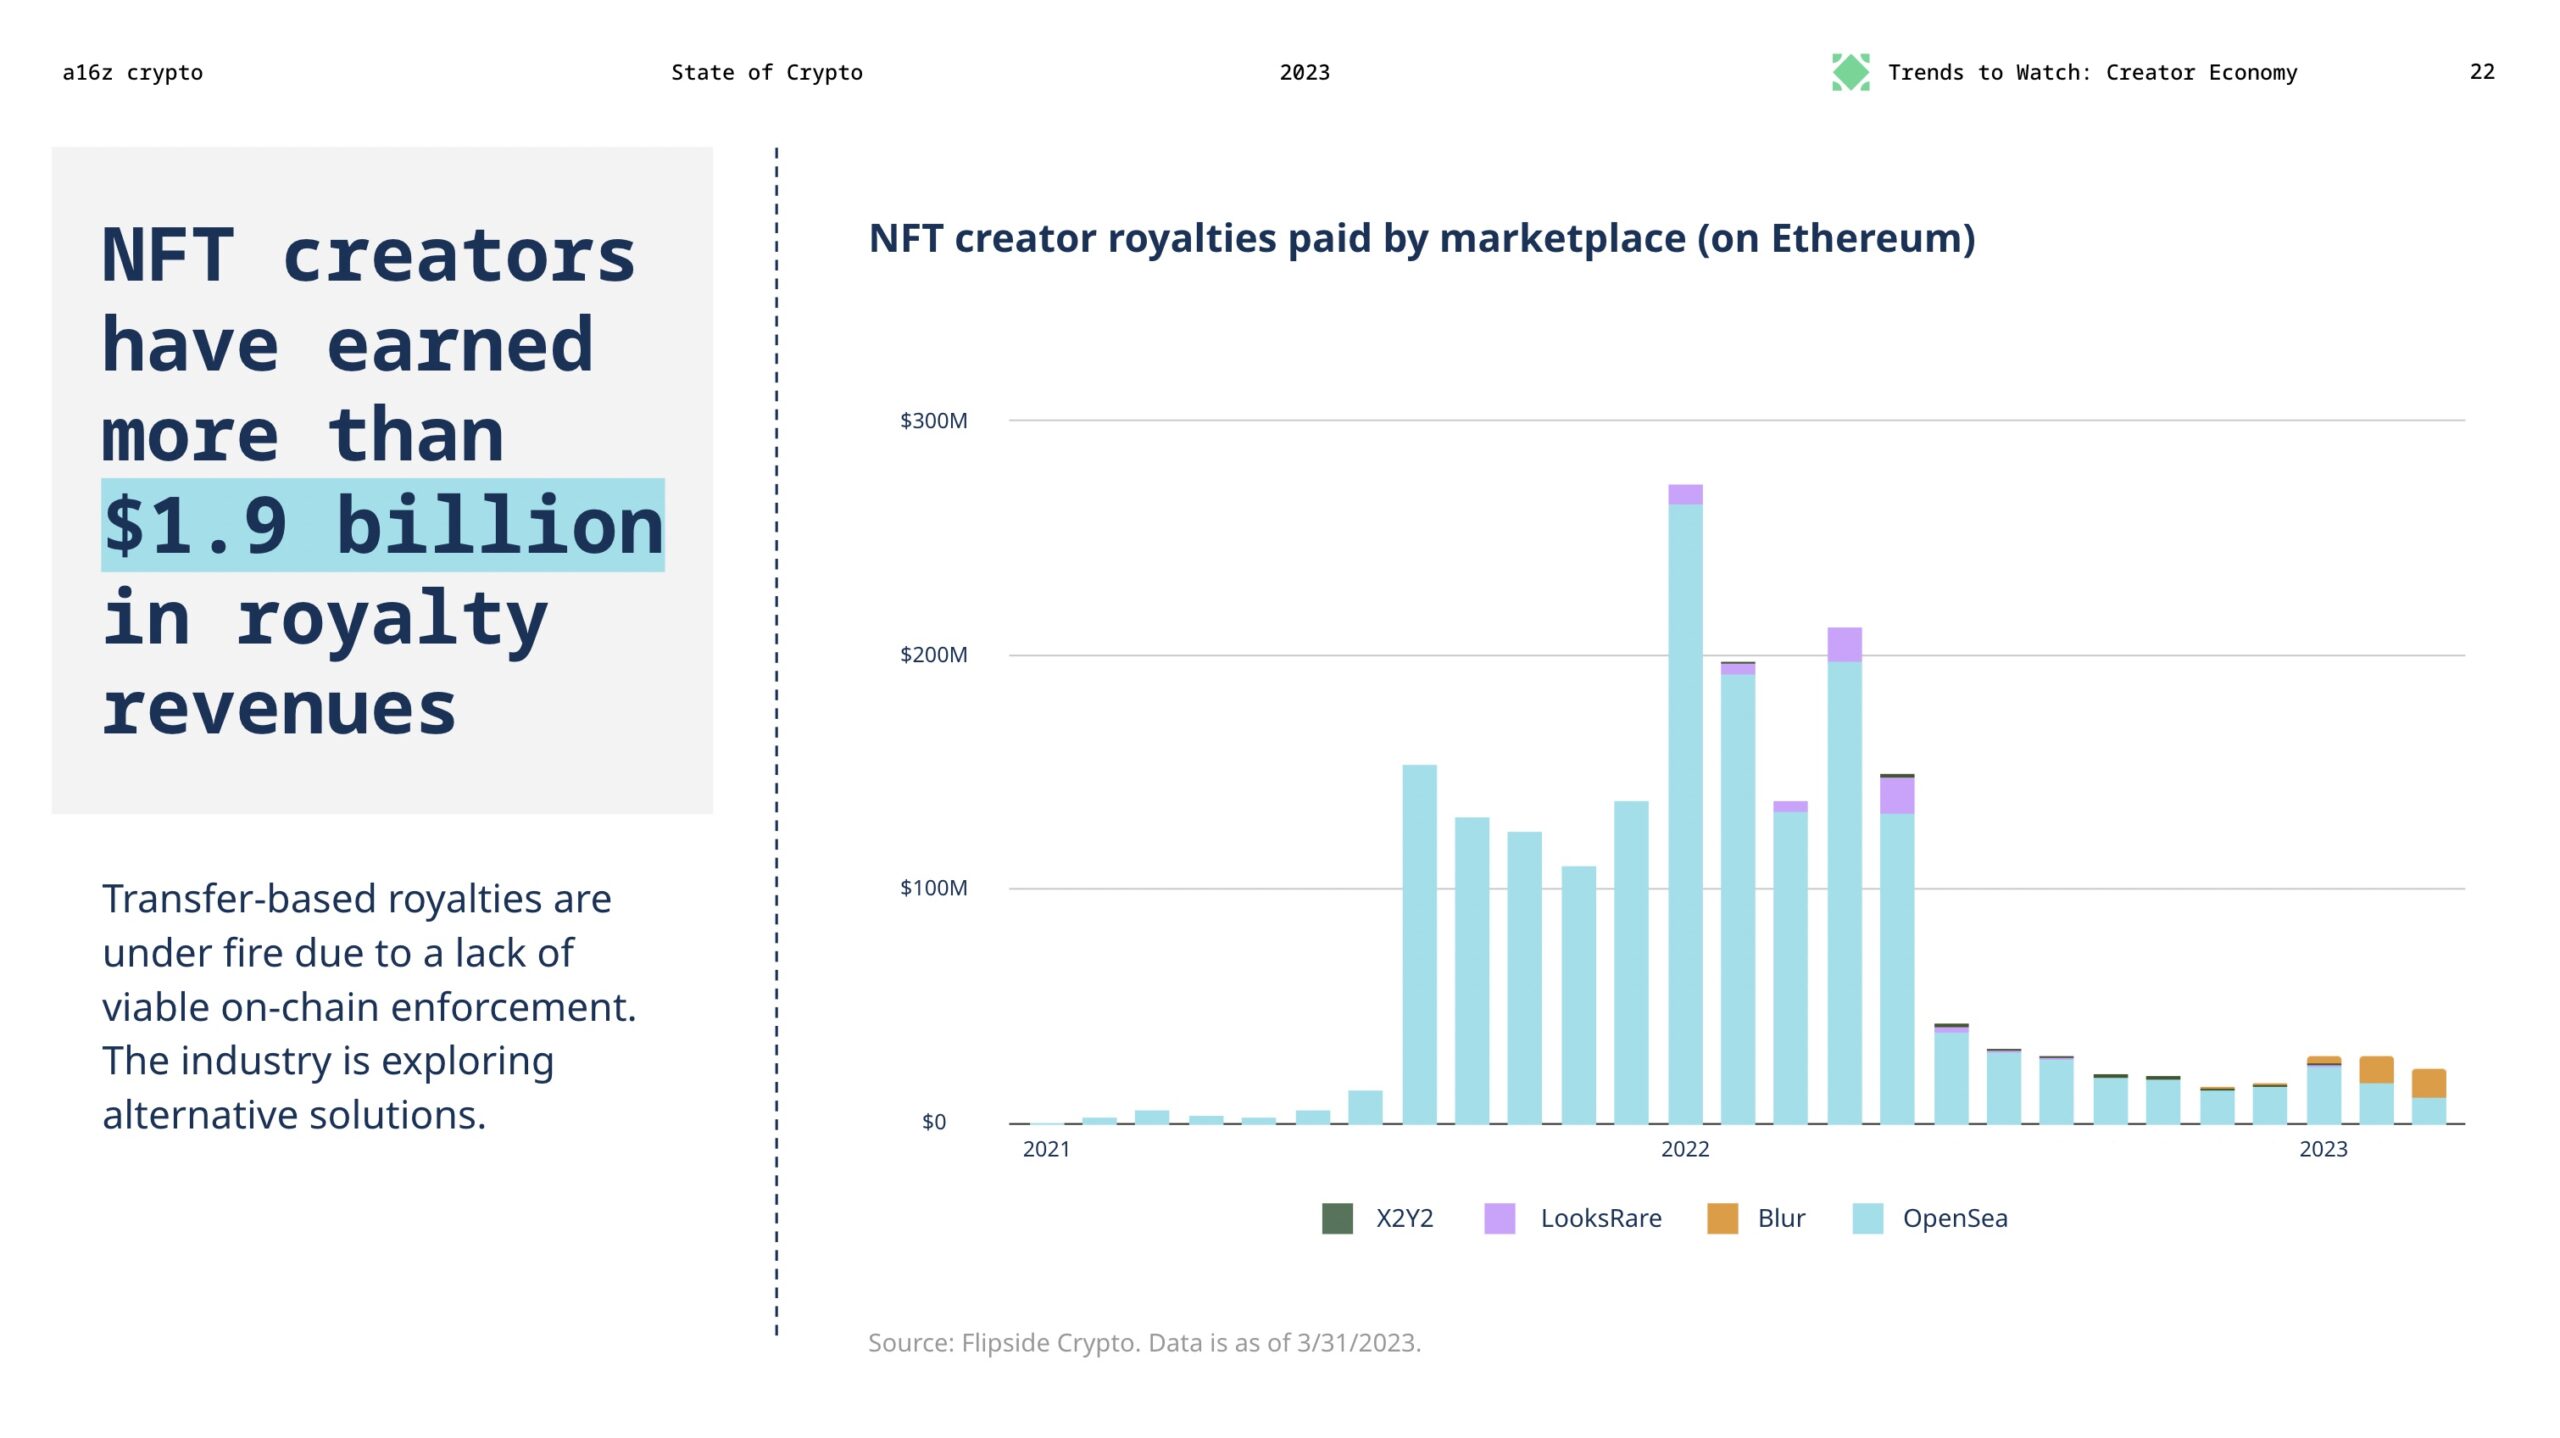 In the last two years, NFT marketplaces have paid out nearly $2 billion worth of royalties in secondary sales to creators. Compare that to web2, where Meta, for instance, earmarked $1 billion for creators through 2022. This comparison is all the more stunning considering that Meta’s platforms – Facebook, Instagram, WhatsApp, and more – have around 3.74 billion monthly users compared to the estimated tens of millions of web3 users today.
It’s worth noting that web3 take rates are, if anything, trending downward over time. While web3 creator royalties are in flux as best practices and technologies evolve in the space, we expect even more innovation and experimentation here.
3. The number of active developers in the crypto industry has held steady
Prices can be misleading, particularly without looking under the hood of web3 technology at its dynamic – and growing – ecosystem of builders.
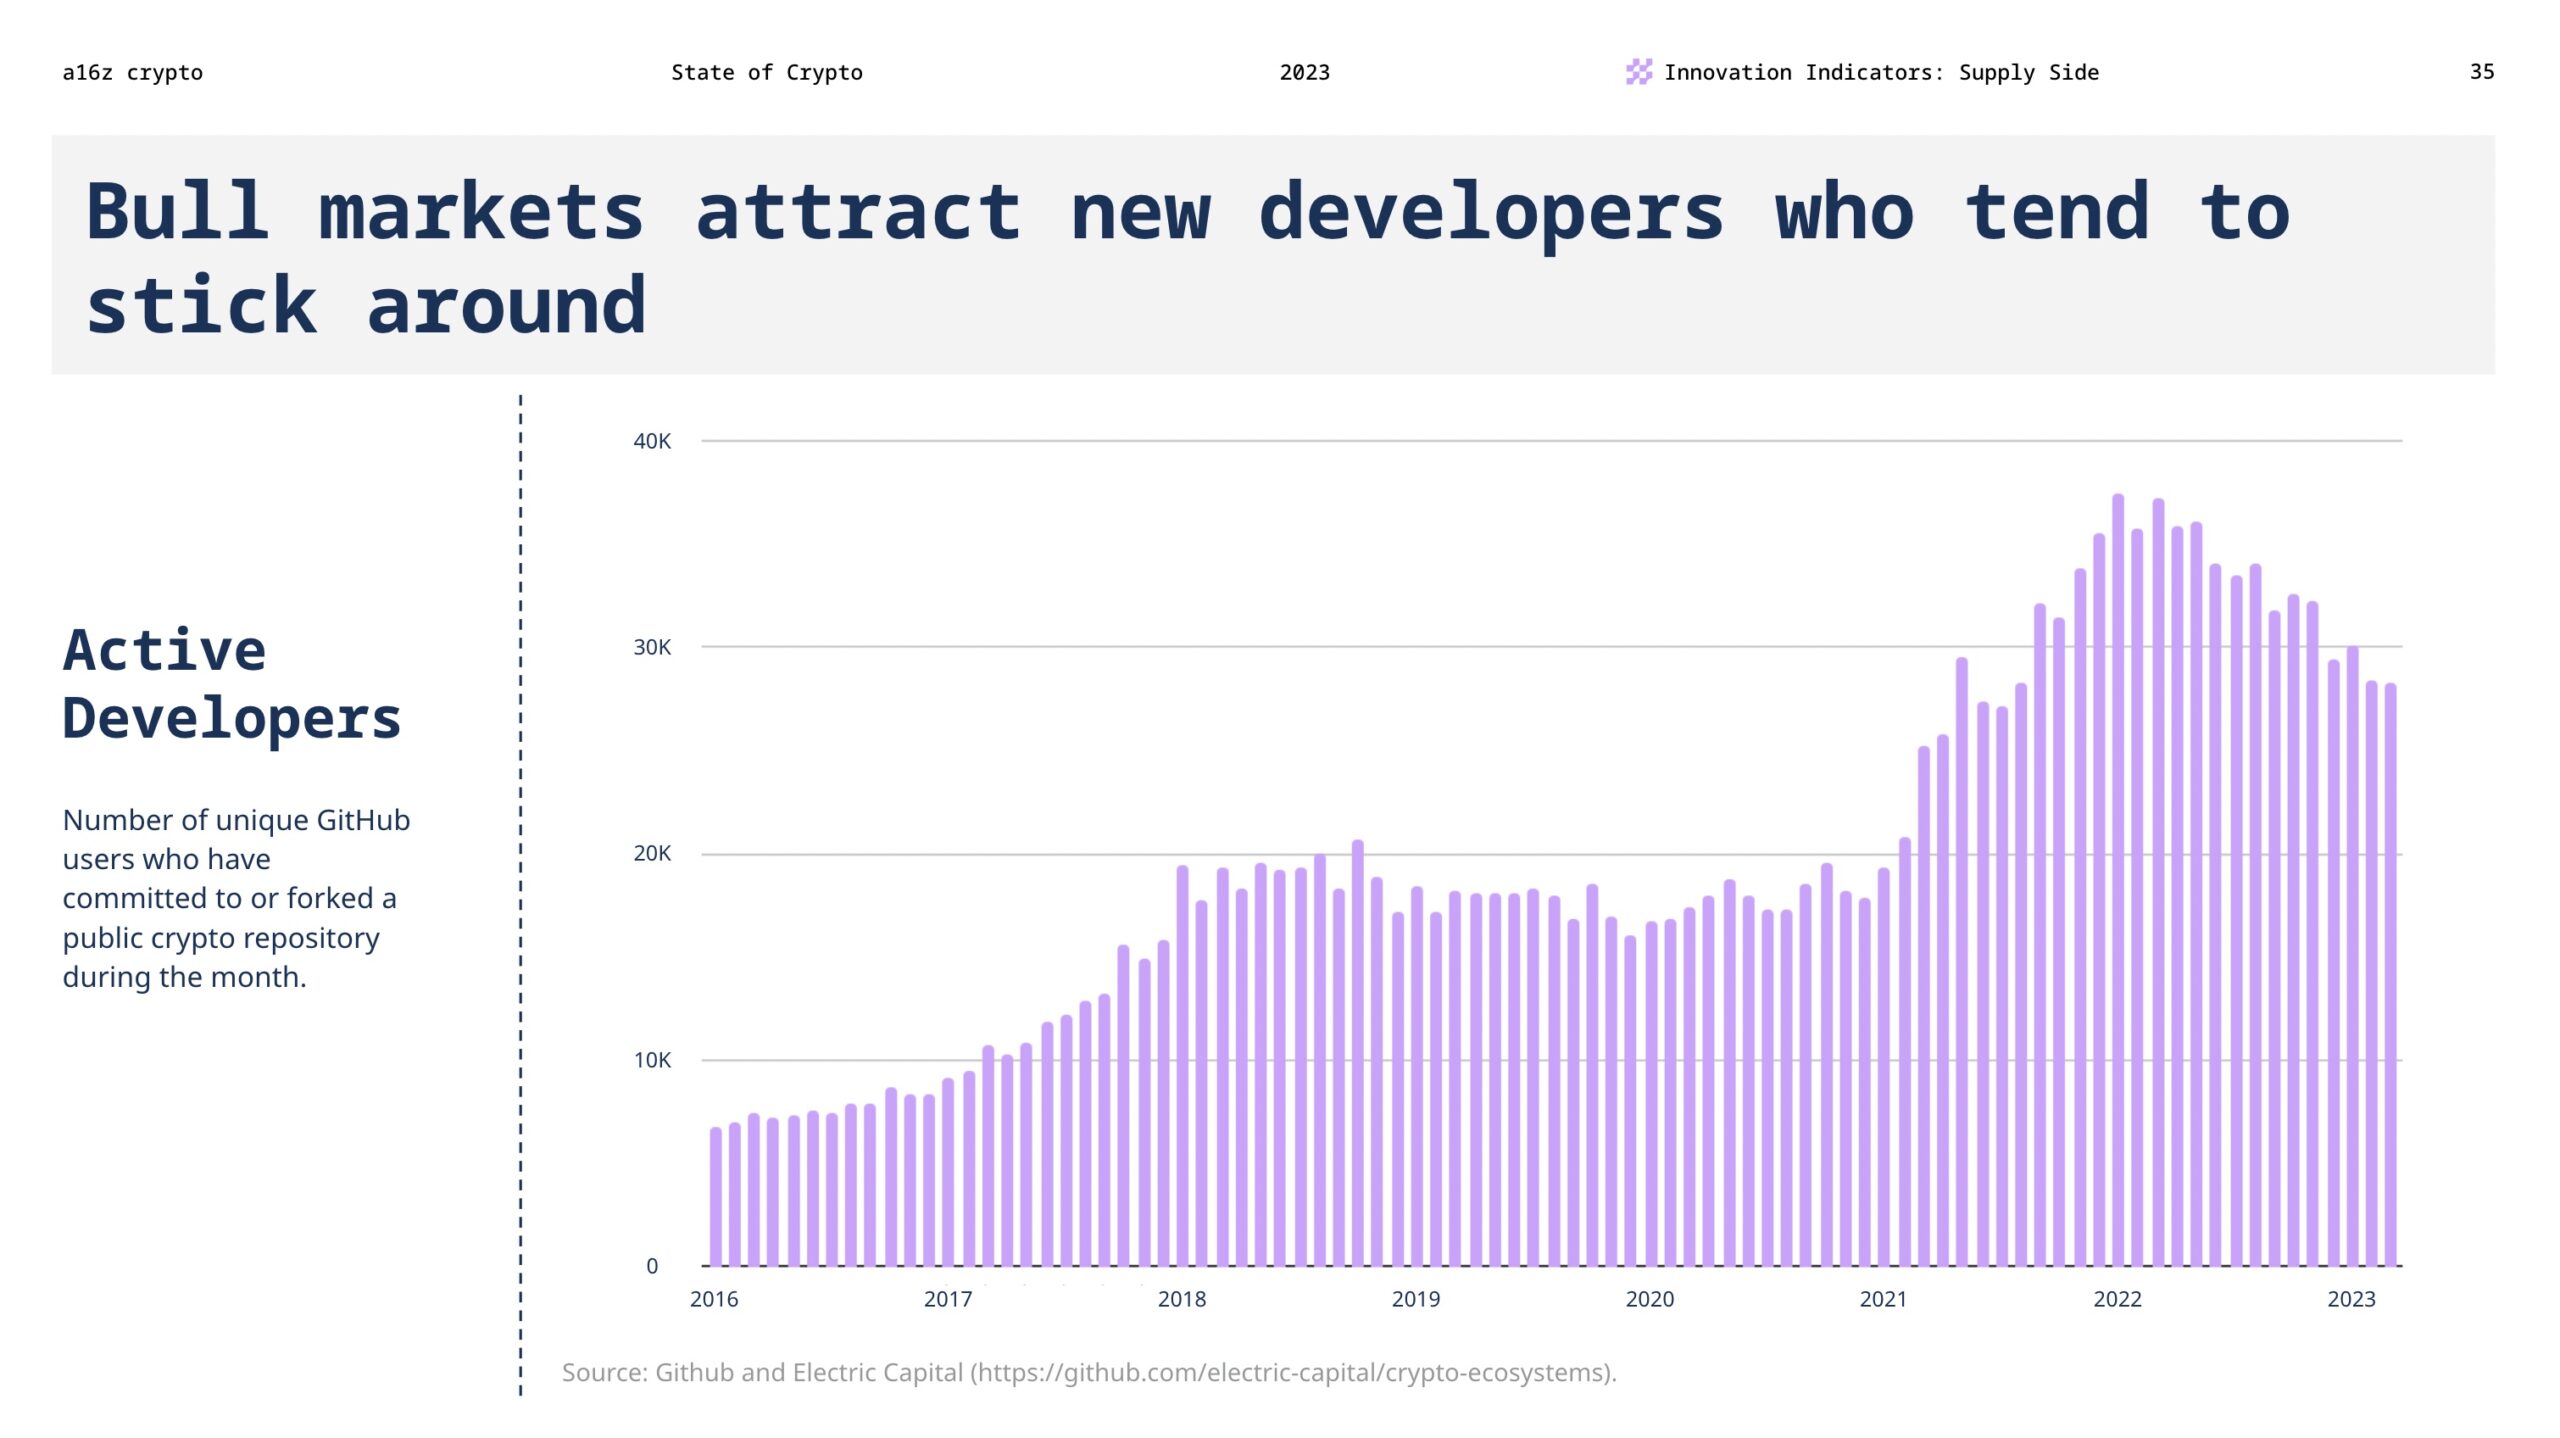
Notably, there was, and continues to be, sustained development across crypto. There are nearly 30K monthly active developers in the crypto industry today. And a steady increase of 60% since the start of the bull run in 2020 indicates that developers that may have been attracted by rising prices are sticking around.
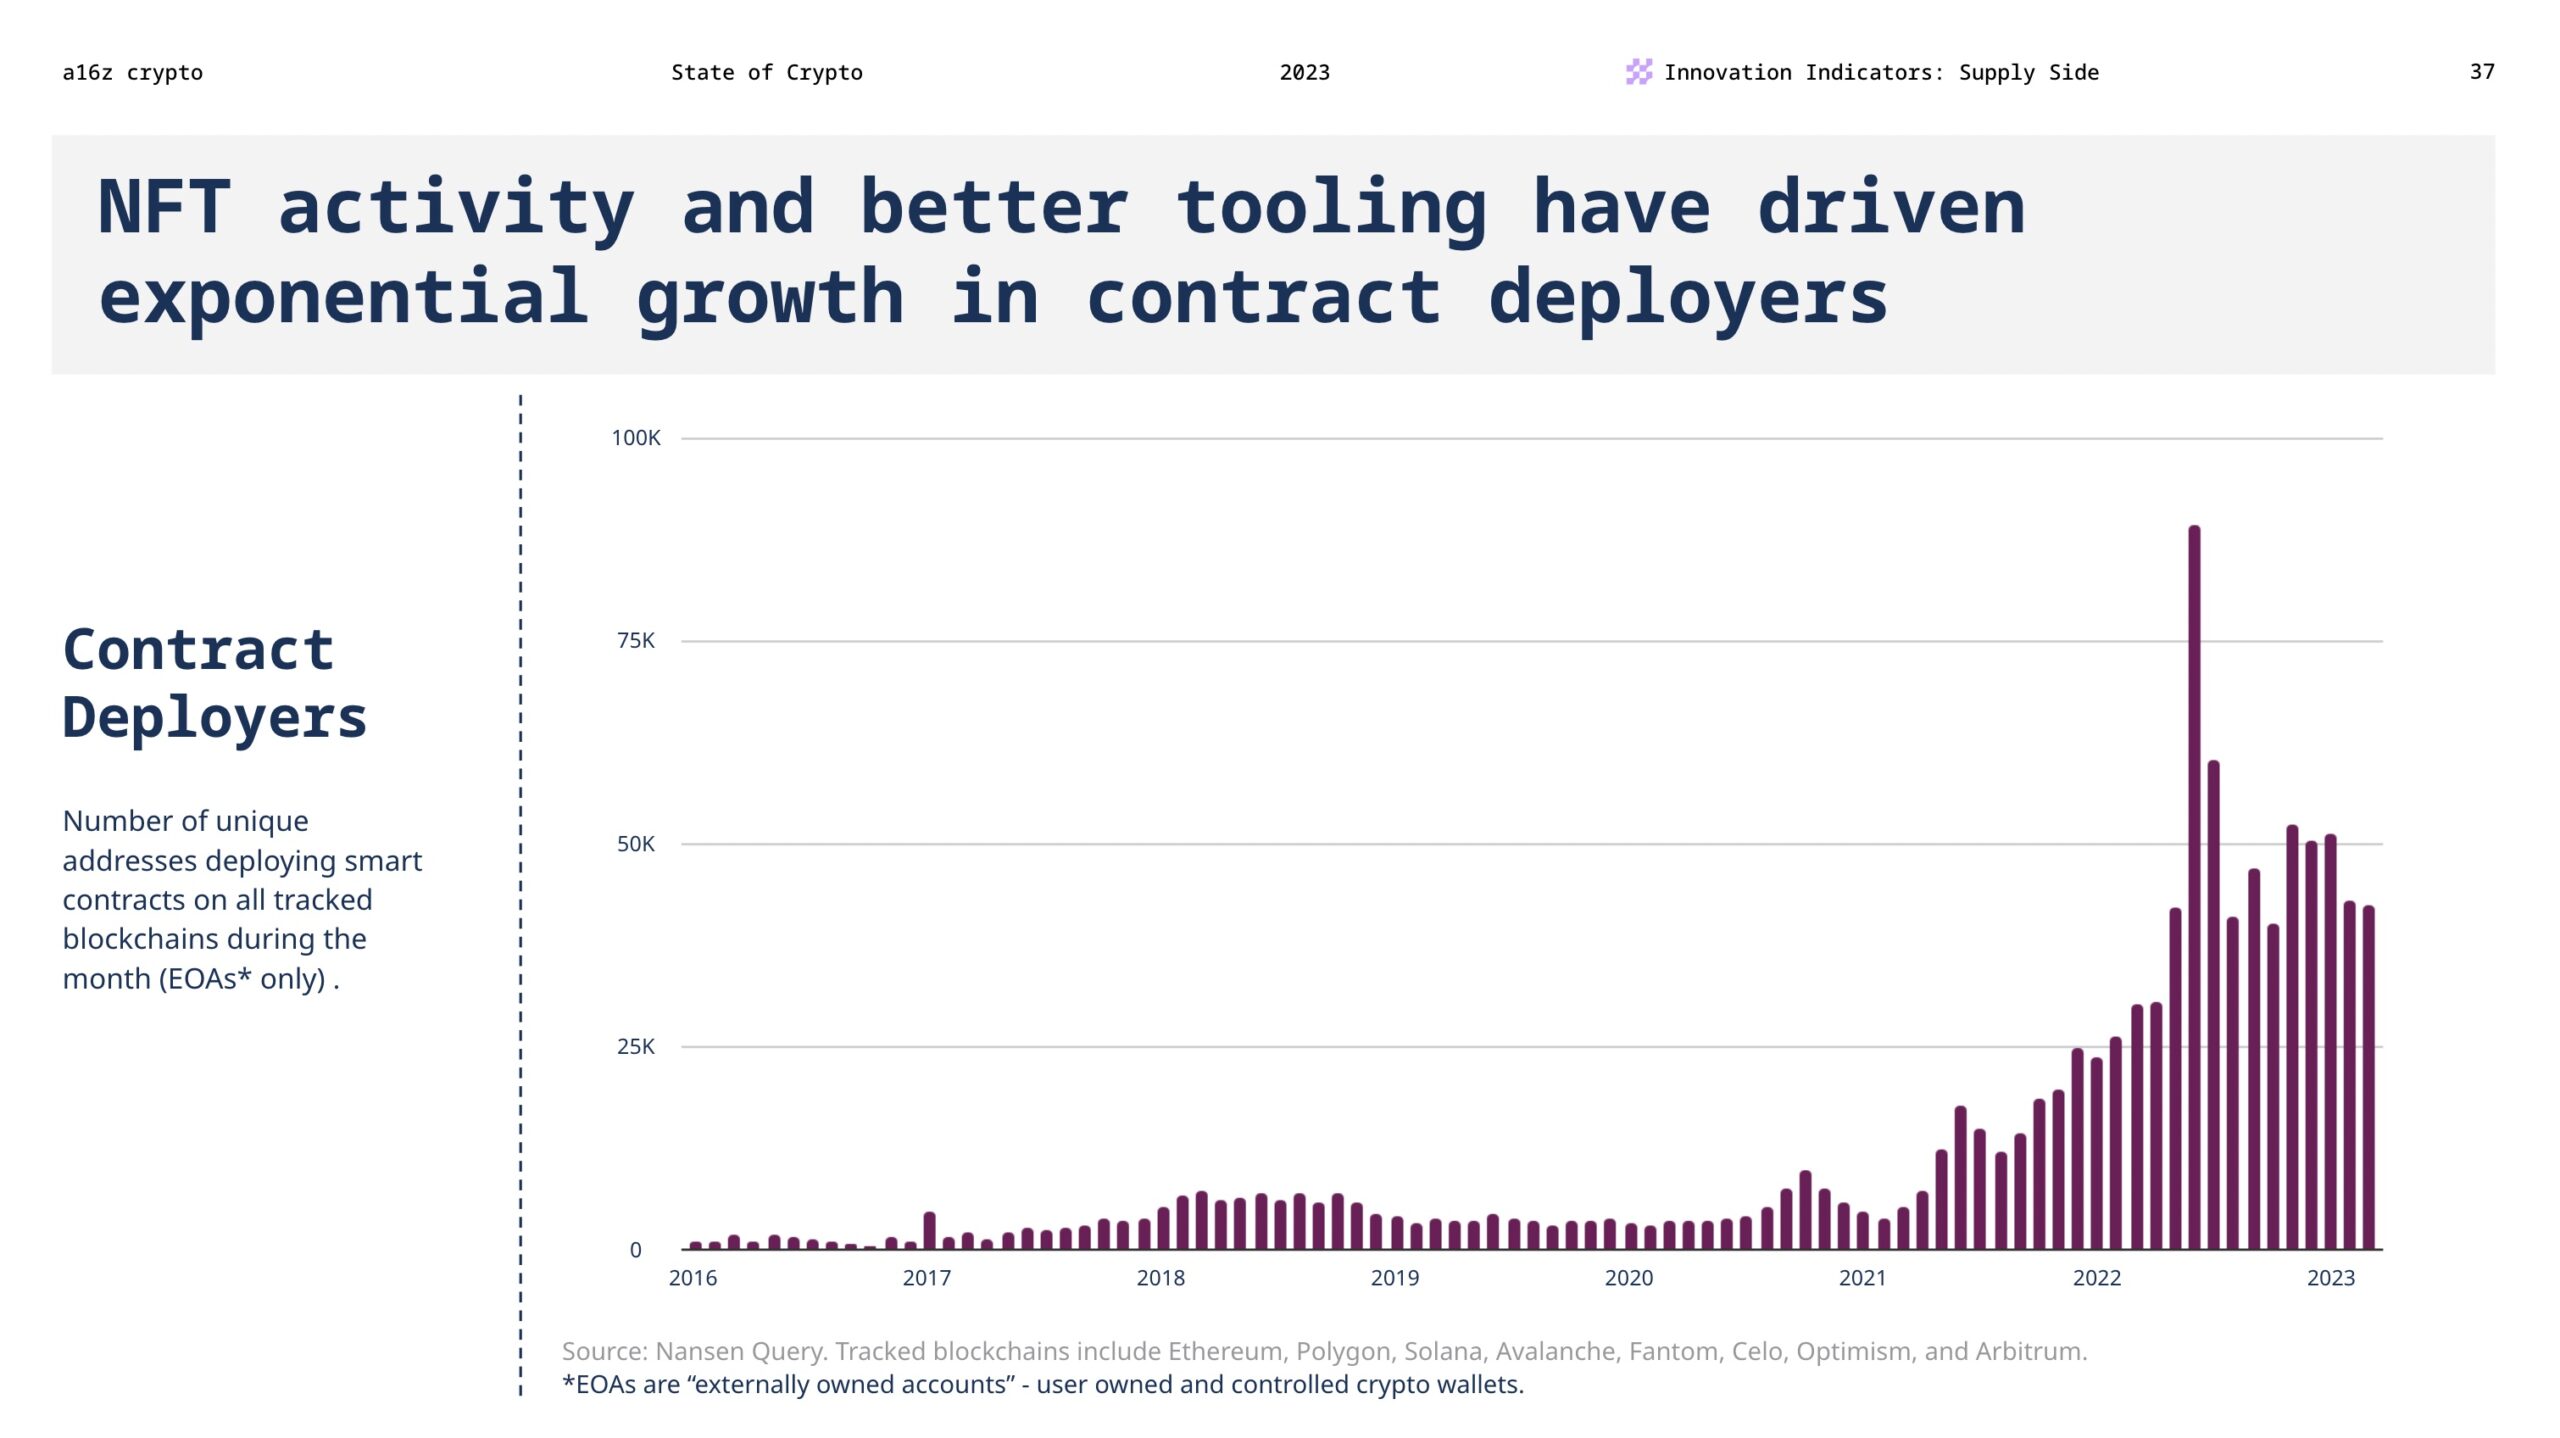
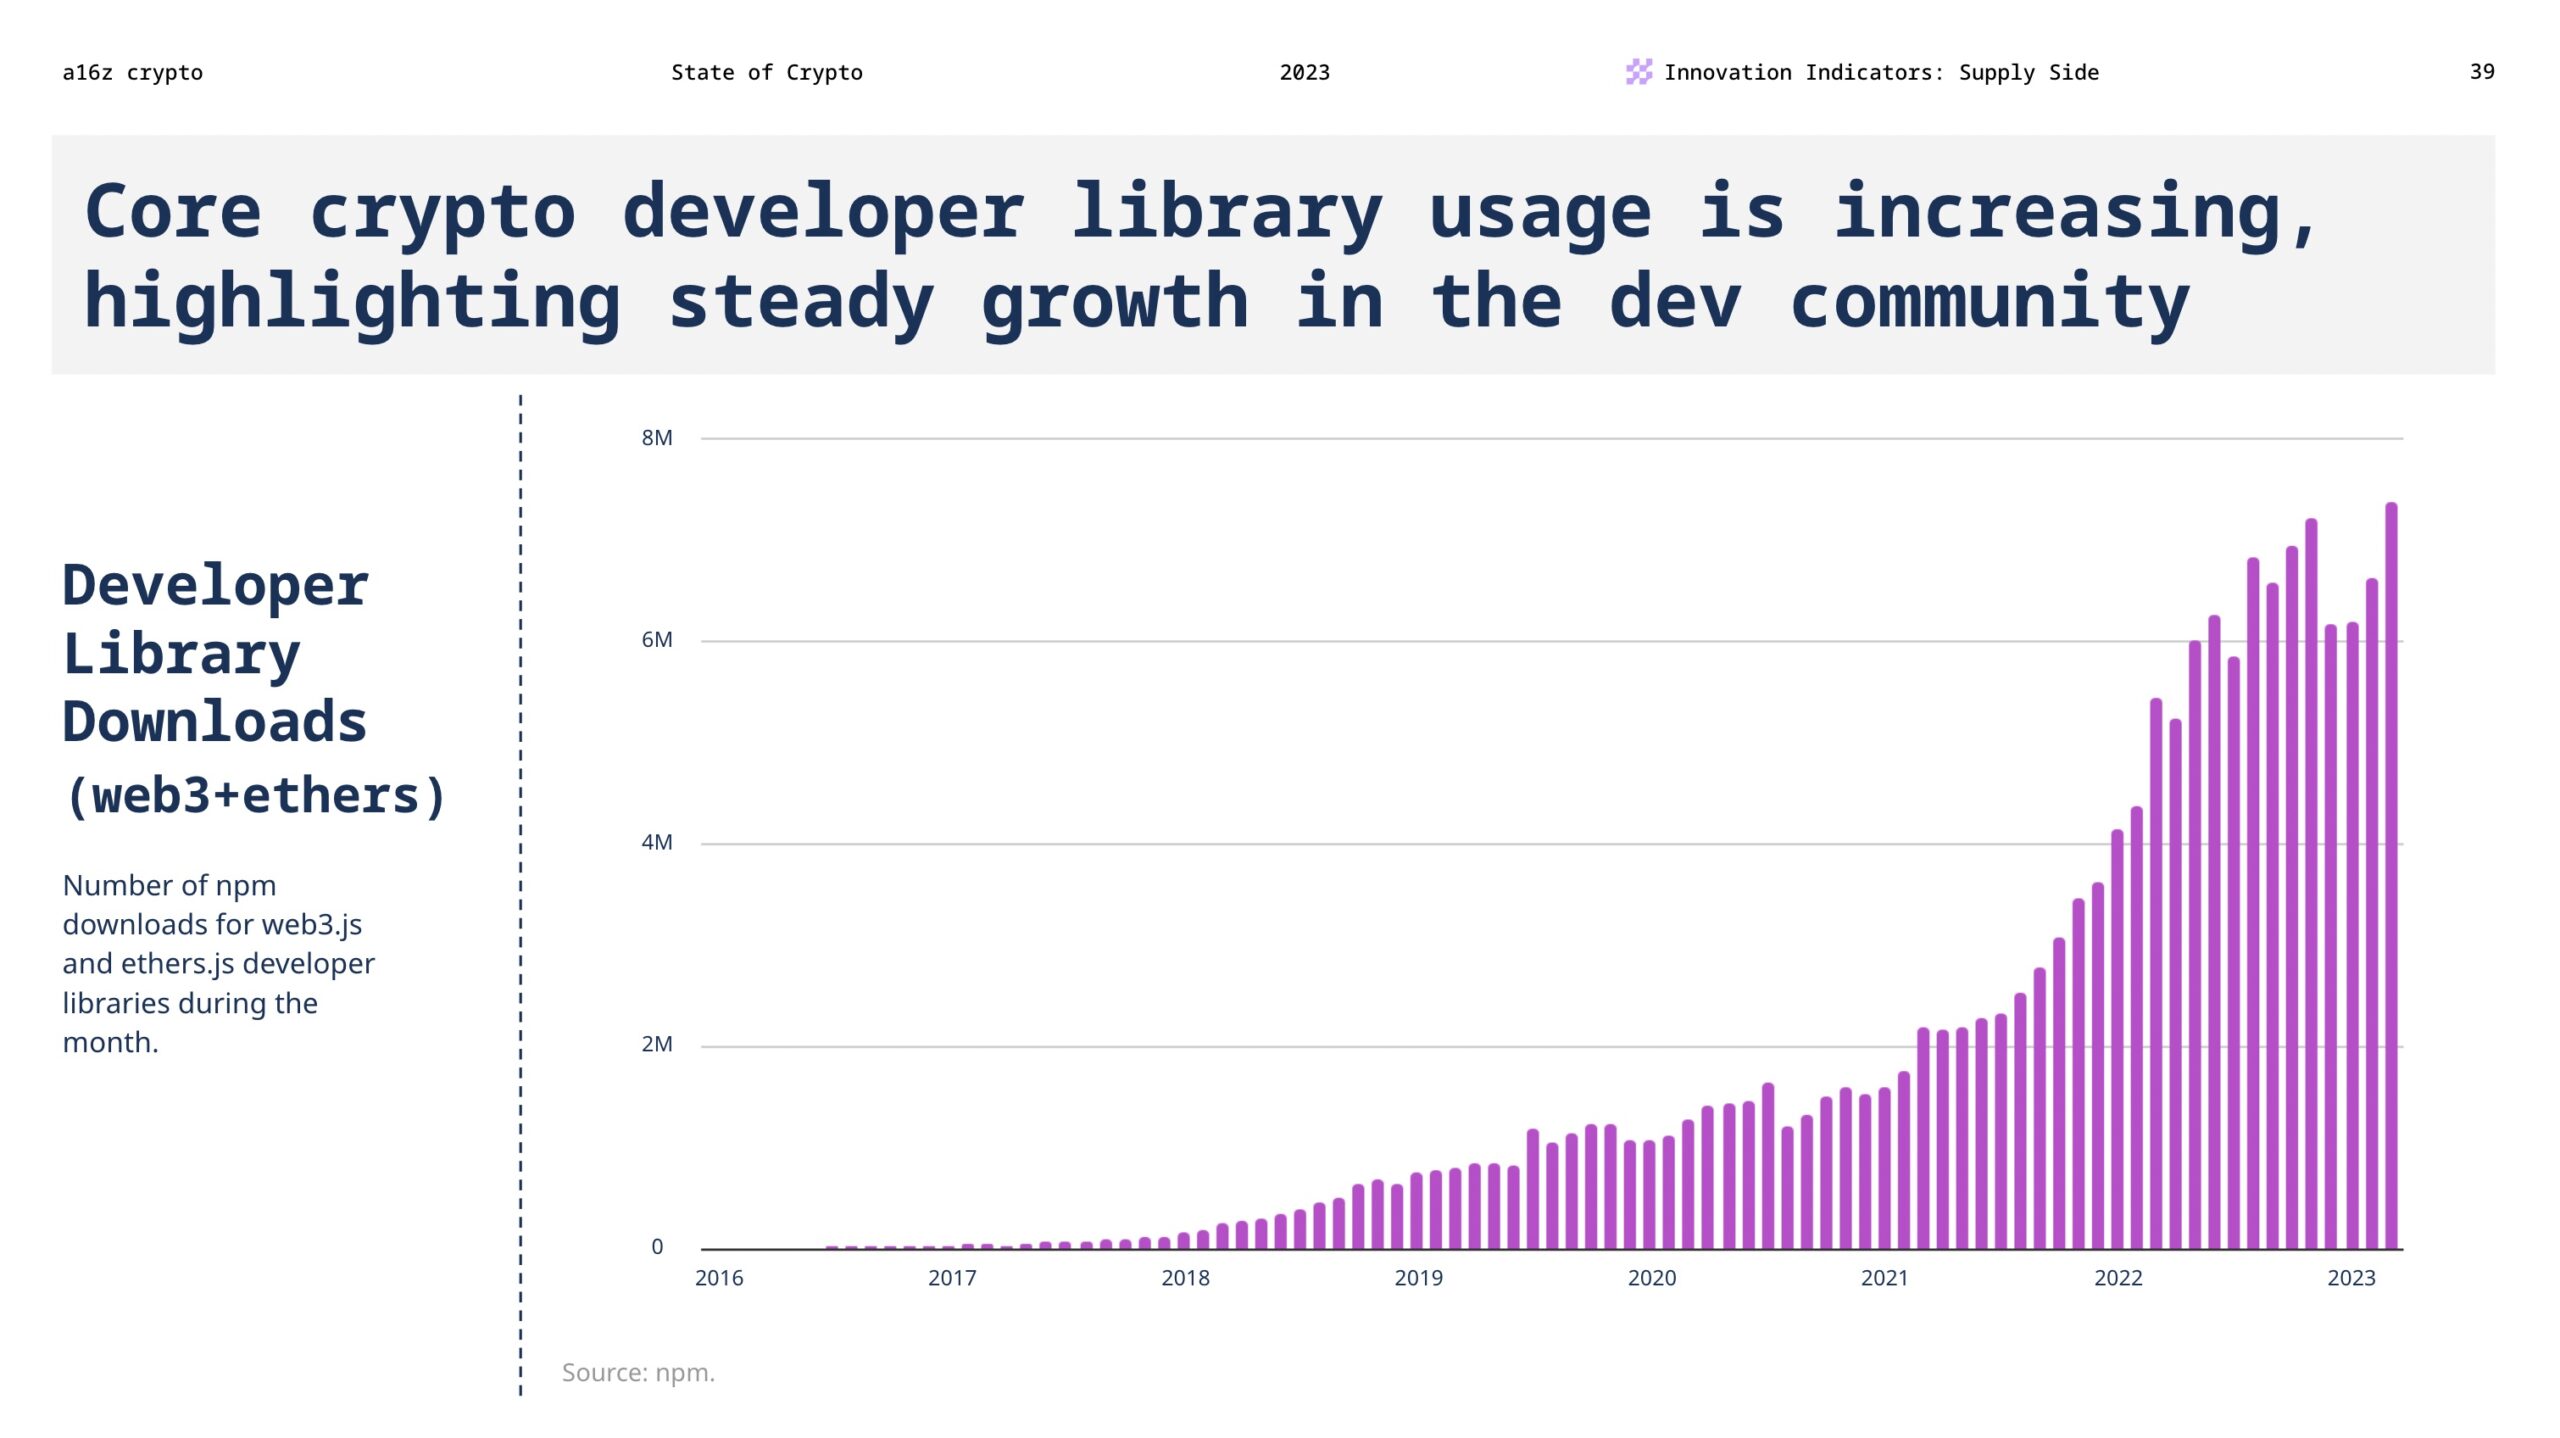
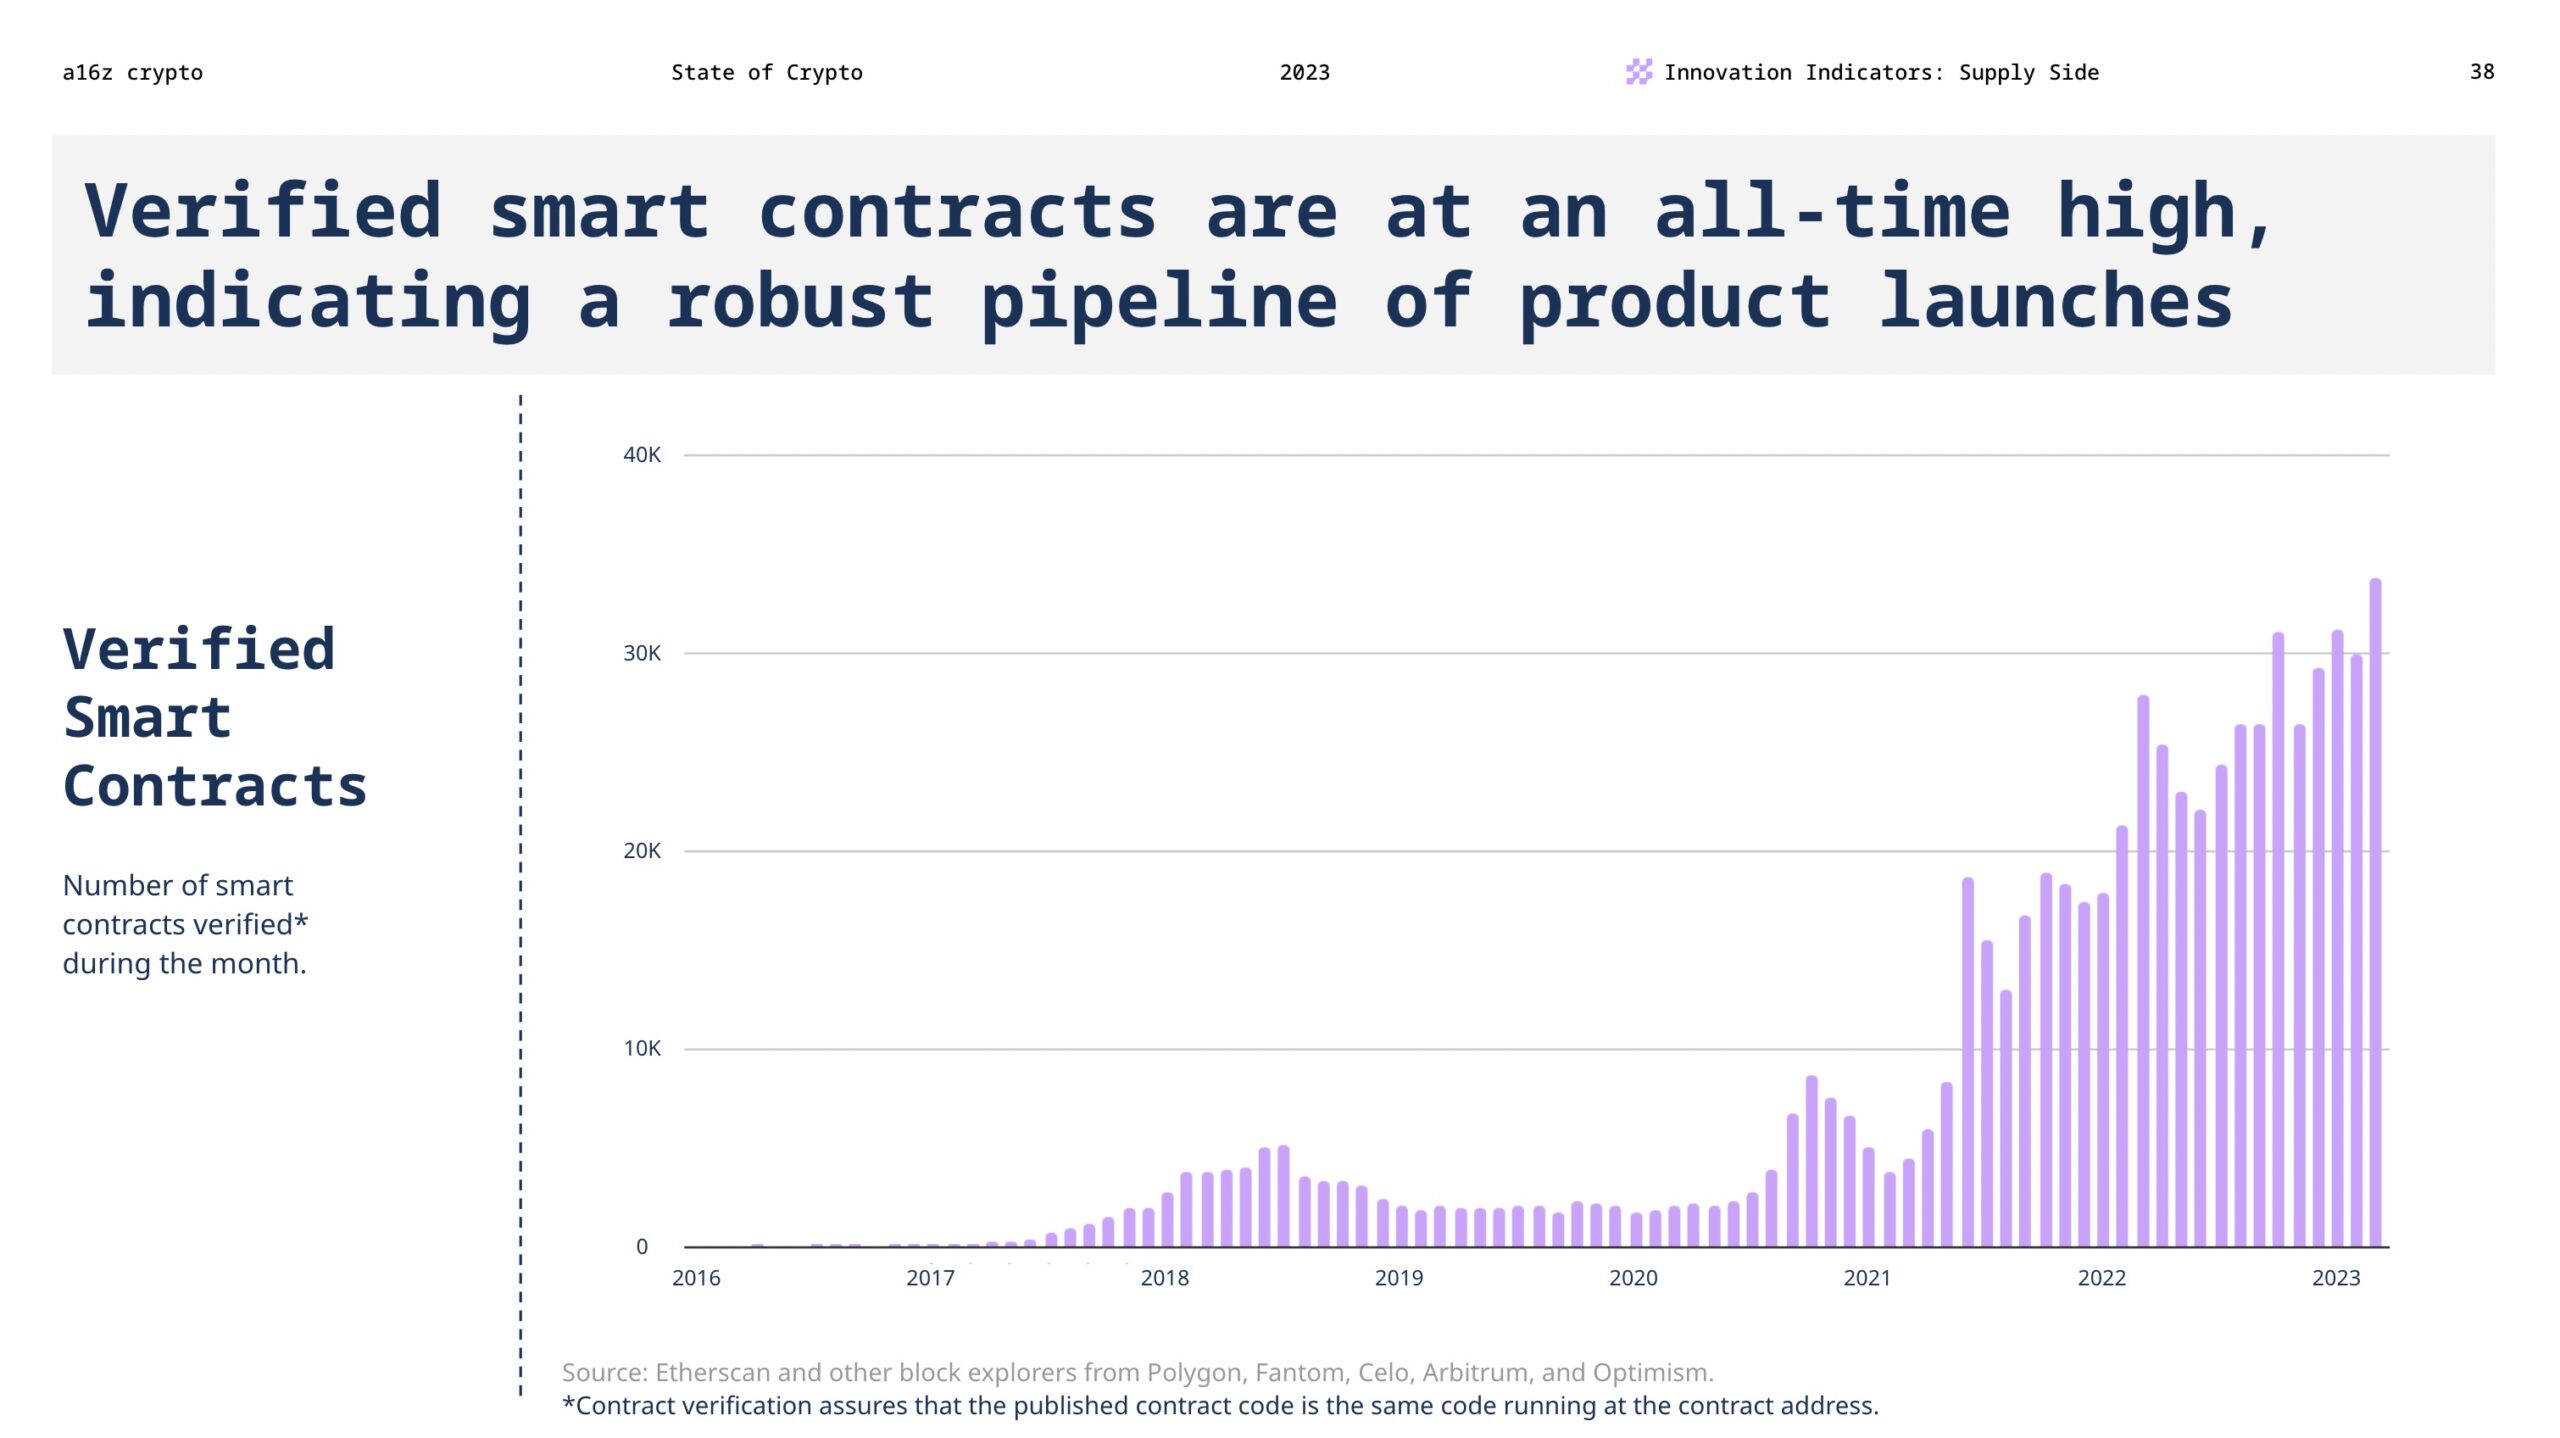
As far as what they’re building: nearly 50K unique addresses deployed smart contracts last month, a 40% rise just this year. More of these contracts were verified, and more core developer libraries were used to interact with them, than we’ve ever tracked.
A key feature of crypto – an open source, decentralized computing platform – is that projects can act as a multiplier when their composable components are reused, recycled, and adapted by others. Composability is to software (as a16z crypto founder and managing partner Chris Dixon says) as compounding interest is to finance: an exponential force.
“There are various exponential forces in the world to look out for, as they can be indicators of rapid future growth. In hardware, the most powerful exponential force is Moore’s Law. In finance, it’s compounding interest. In software, it’s composability.”
Consider Uniswap: it started as a protocol for exchanging tokens, and it has developed into critical infrastructure enabling an ecosystem of new DeFi applications.
4. Blockchains are scaling through promising new paths
Blockchain scaling welcomes more people, more transactions, and more complex applications into the fold. Now we’re seeing many promising new paths; it’s a dynamic design space for web3 developers trying to solve foundational challenges.
Let’s start with “Layer 2” blockchains: the technology designed to scale underlying Layer 1 blockchains, like Ethereum, by offering up more blockspace, increasing transaction throughput, and lowering fees. Last year L2s accounted for 1.5% of the fees paid on Ethereum. That share has since more than quadrupled to 7% of the total fees paid on Ethereum – indicating that more applications are choosing to build on L2s. We expect this trend to continue, and benefit end users.
Finally, one of the most momentous events in the history of open source development – given the scope of the challenge, the nature of the distributed coordination, and more – took place last fall. Ethereum underwent a major upgrade when the network transitioned from “proof-of-work” to a “proof-of-stake” consensus mechanism. “The Merge” marked an architectural shift that massively reduced Ethereum’s energy footprint:
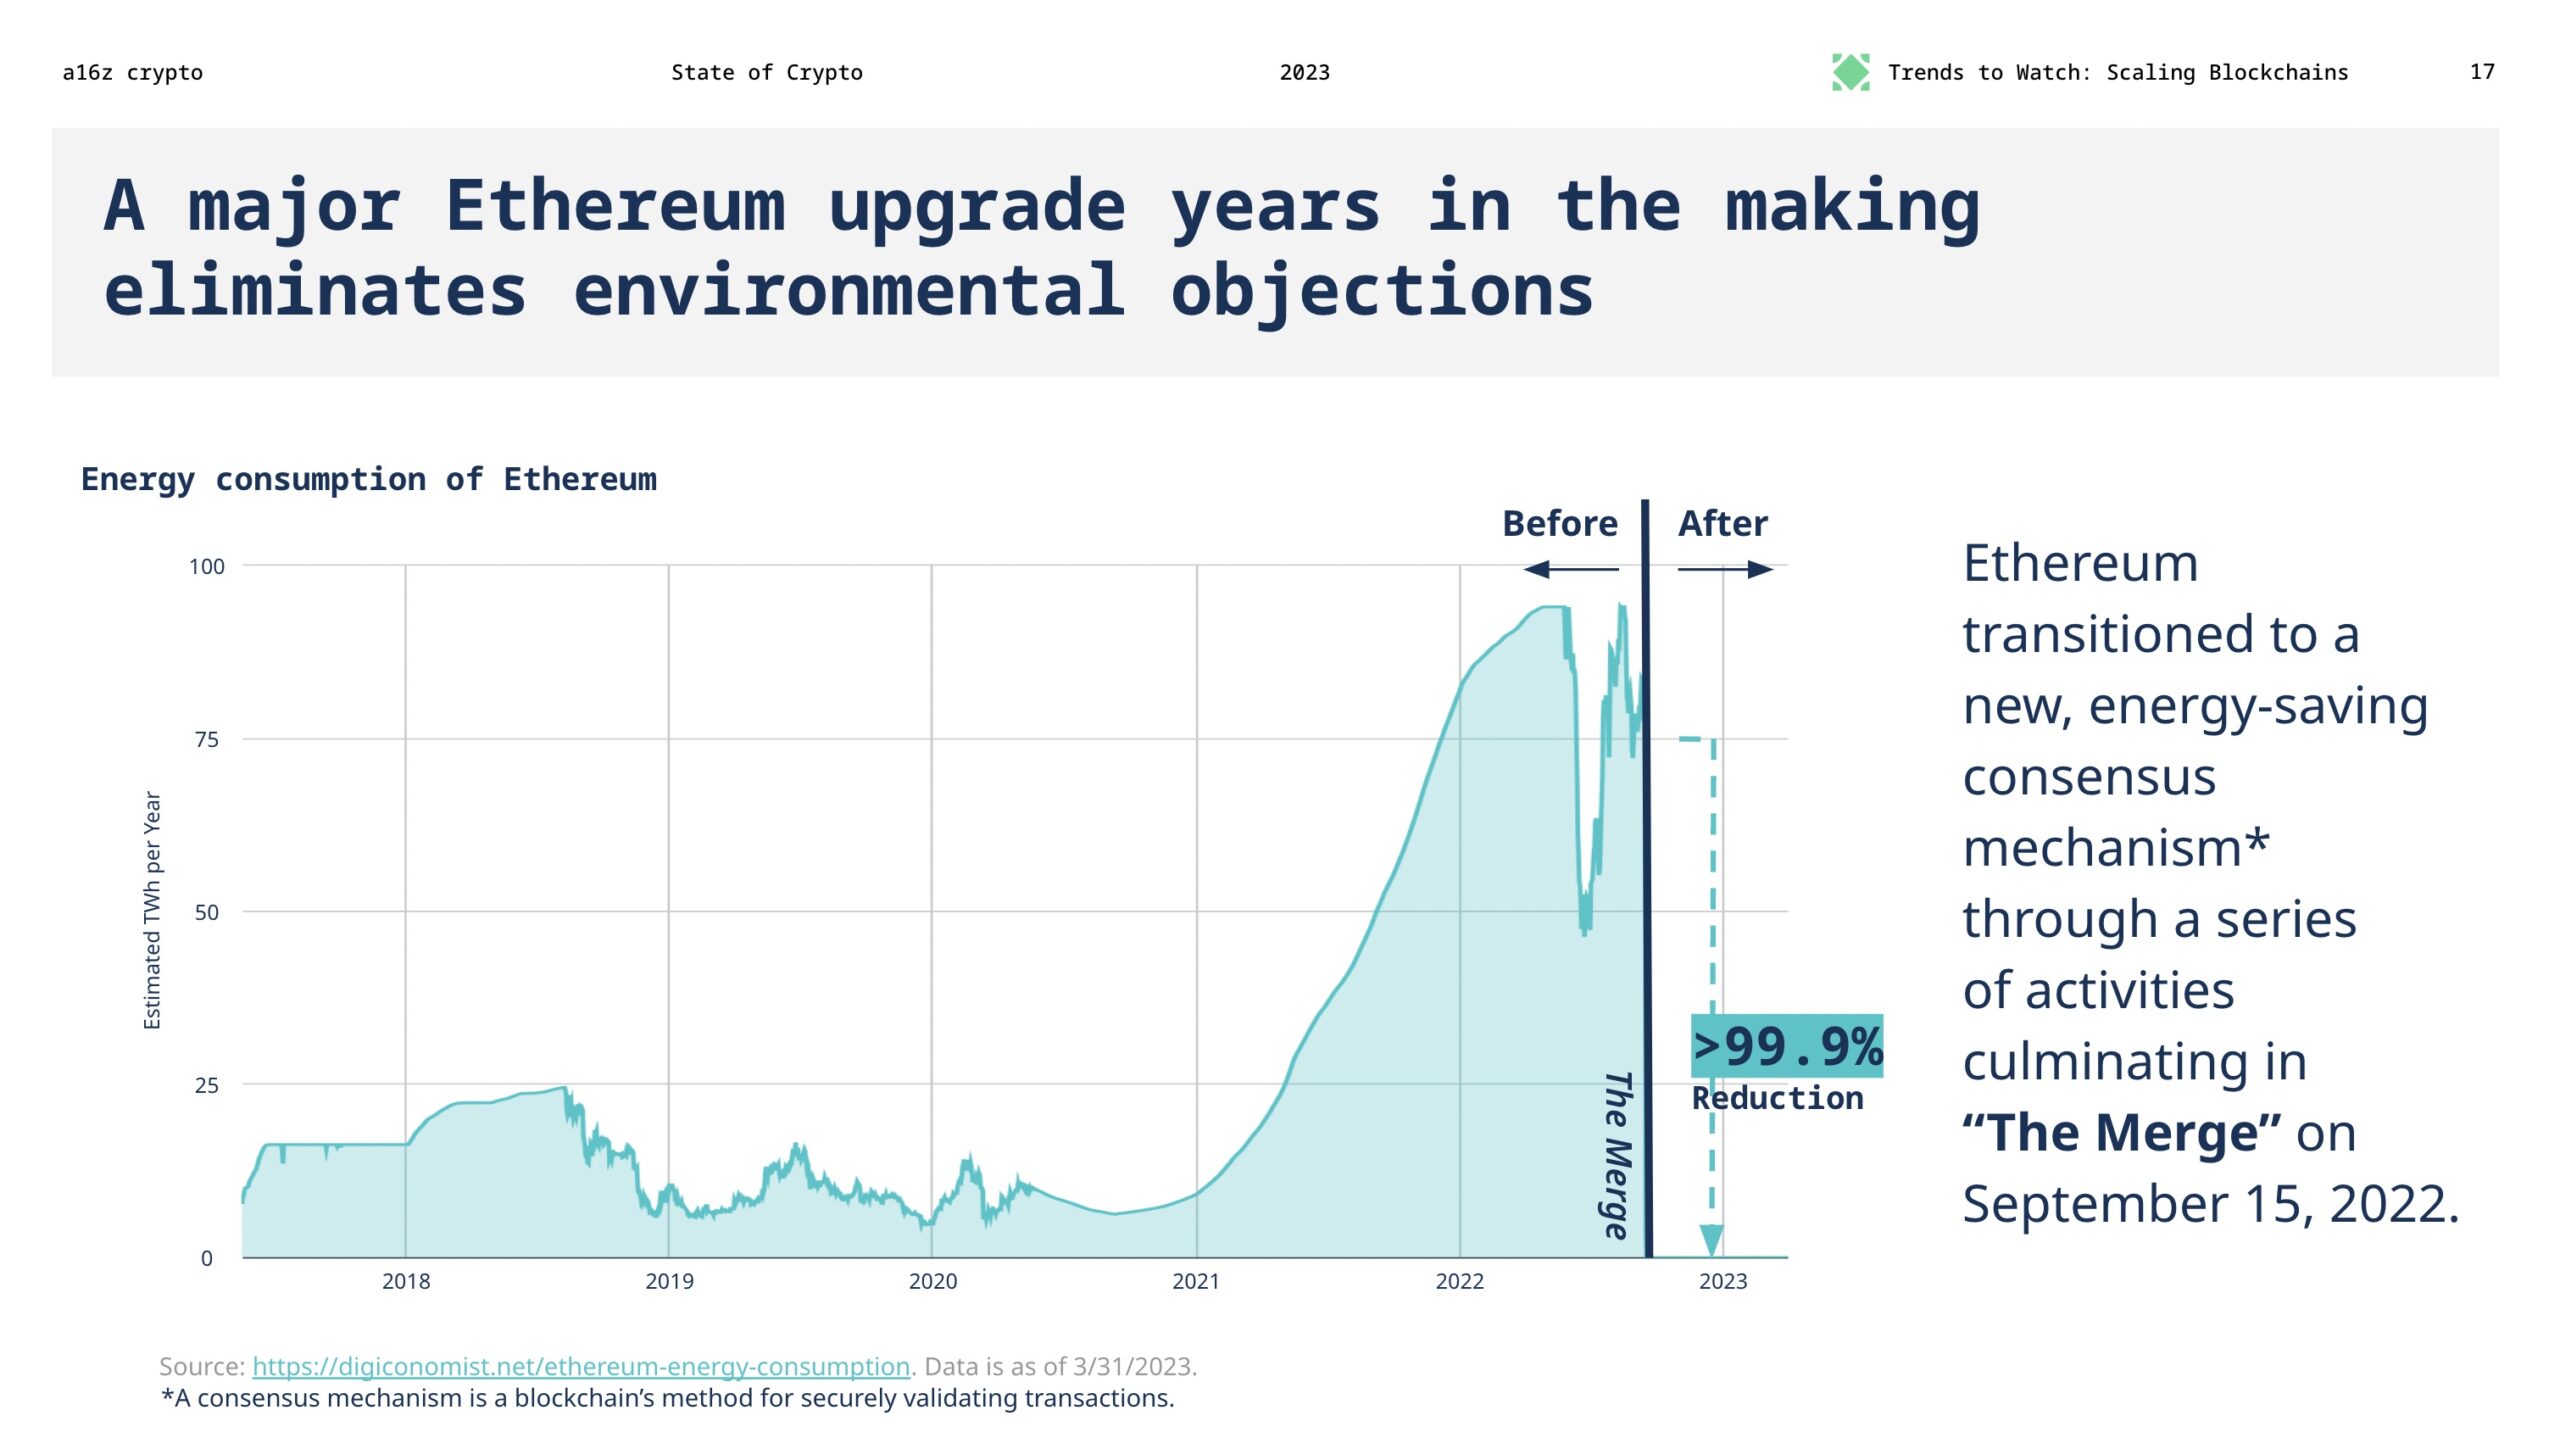
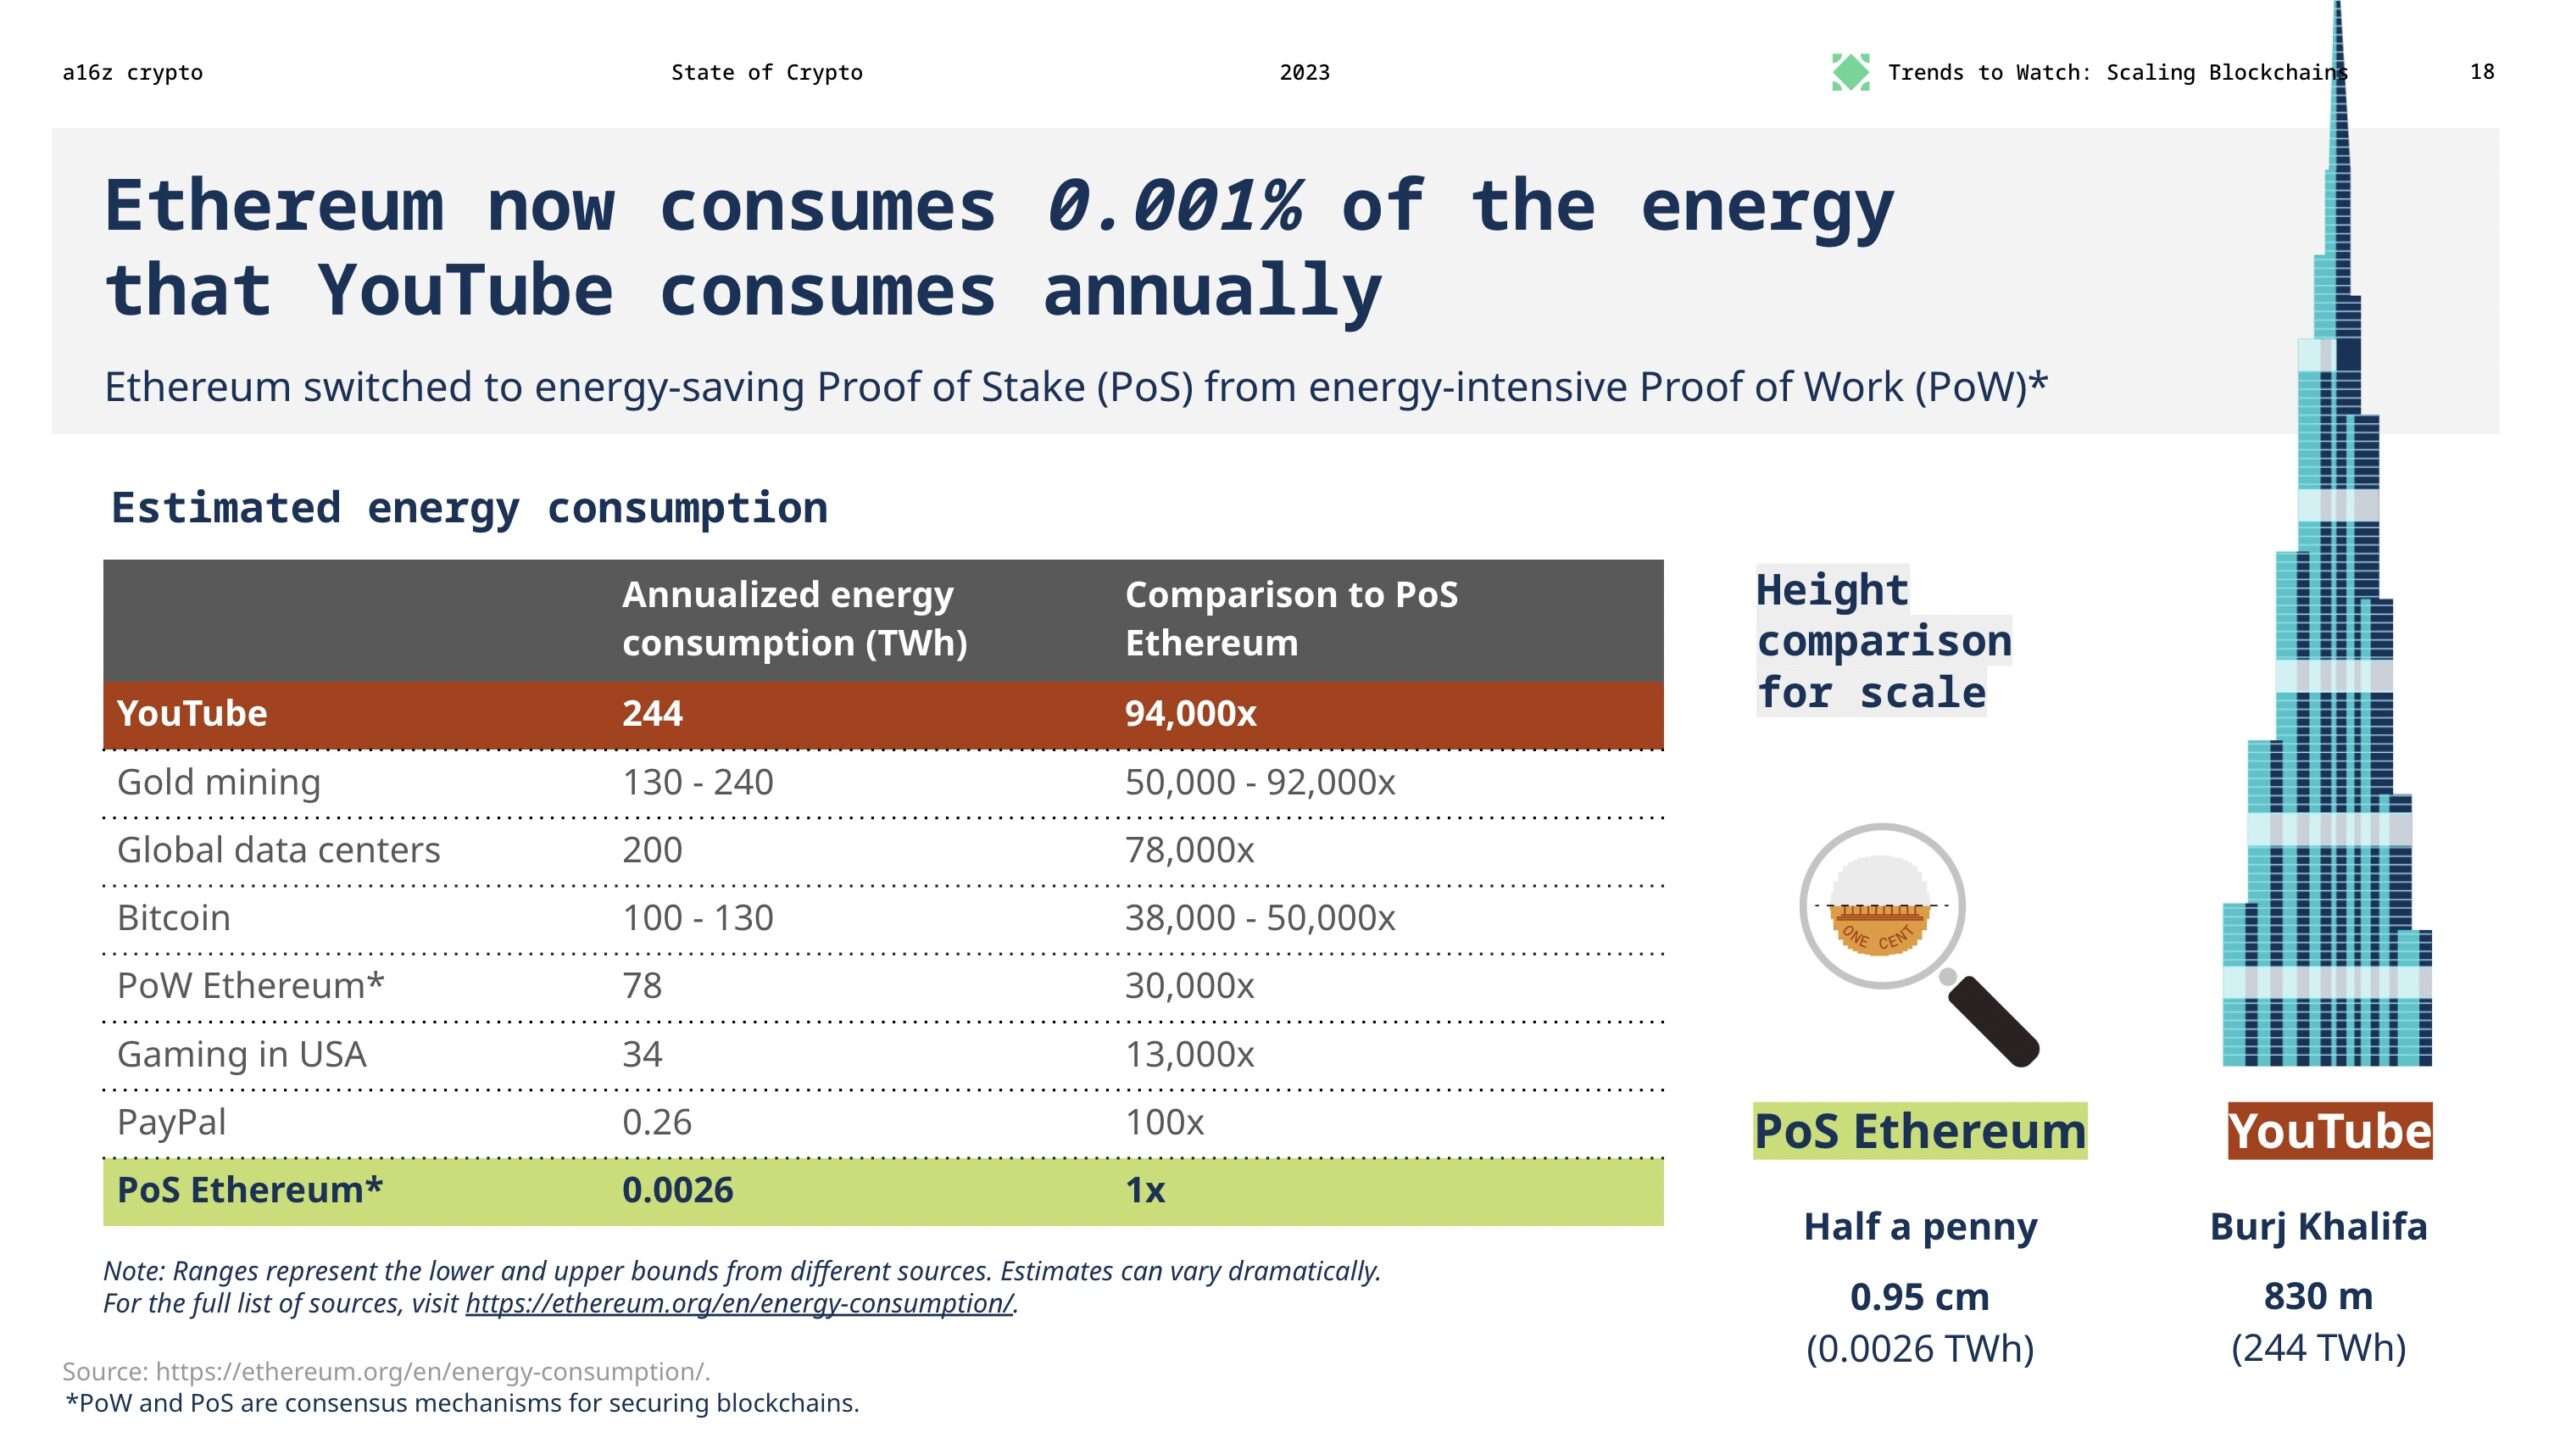
Compare this to web2 giants: YouTube consumes an estimated 244 Terawatt hours annually, or 94,000x as much energy per year as Ethereum.
5. New technologies, once practically impossible, are becoming very real
Over the last year we have seen rapid progress in the field of “zero knowledge” systems — powerful, foundational technologies that unlock blockchain scalability, along with a proliferation of new use cases including privacy-preserving applications and verifiable compute that could enable decentralized machine learning/AI. These systems (including zero knowledge proofs) involve cryptographic methods for proving or verifying a set of facts is true without revealing any information about those facts.
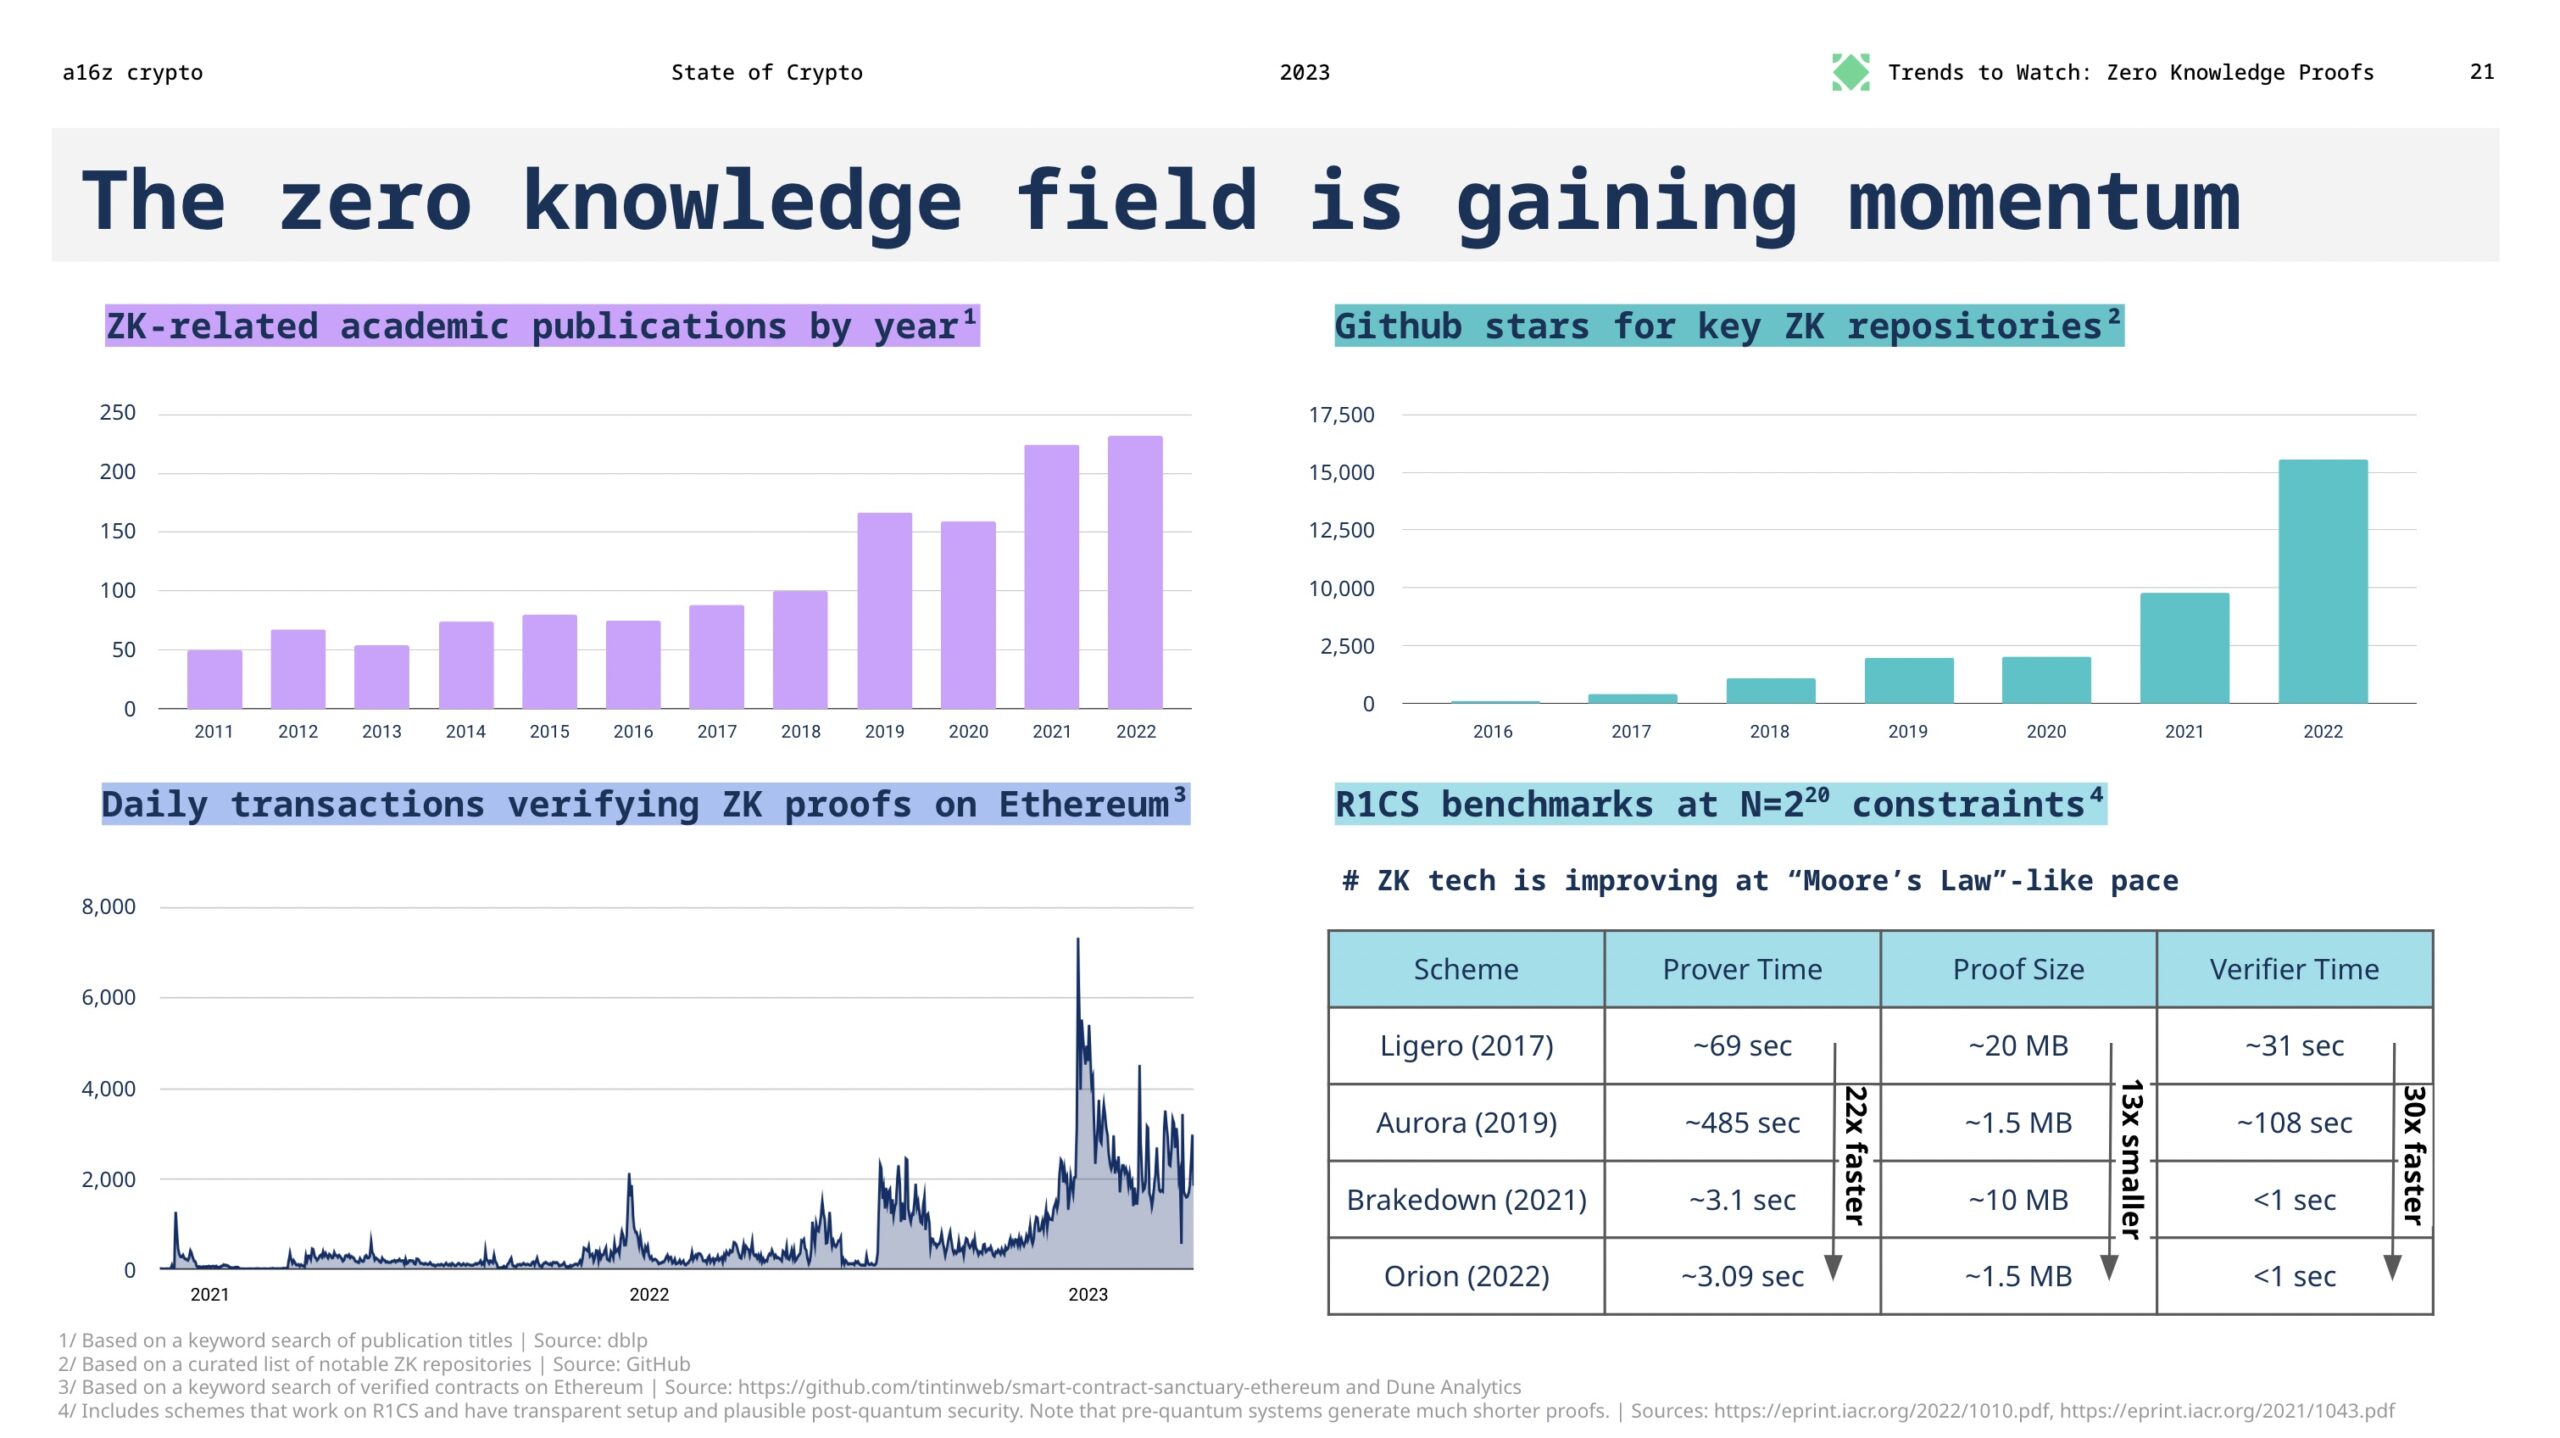
This work, decades in the making, has moved from theory to practice in the last few years. We seem to see the technology following “Moore’s Law”-like paces here. Though evaluating benchmarks requires a lot of nuance, the acceleration of progress, from provers and verifiers to circuits and hardware and more is incredibly promising.
6. The U.S. is losing its lead in web3
As a set of emerging technologies, crypto needs thoughtful policy and regulatory guardrails to safely grow and meet its economic potential for the U.S. economy.
There has been much debate, but little regulatory clarity, which has hindered web3’s growth. As a result, America’s edge may be slipping. Between 2018 and 2022, the proportion of crypto developers based in the U.S. vs. the rest of the world fell 26%.
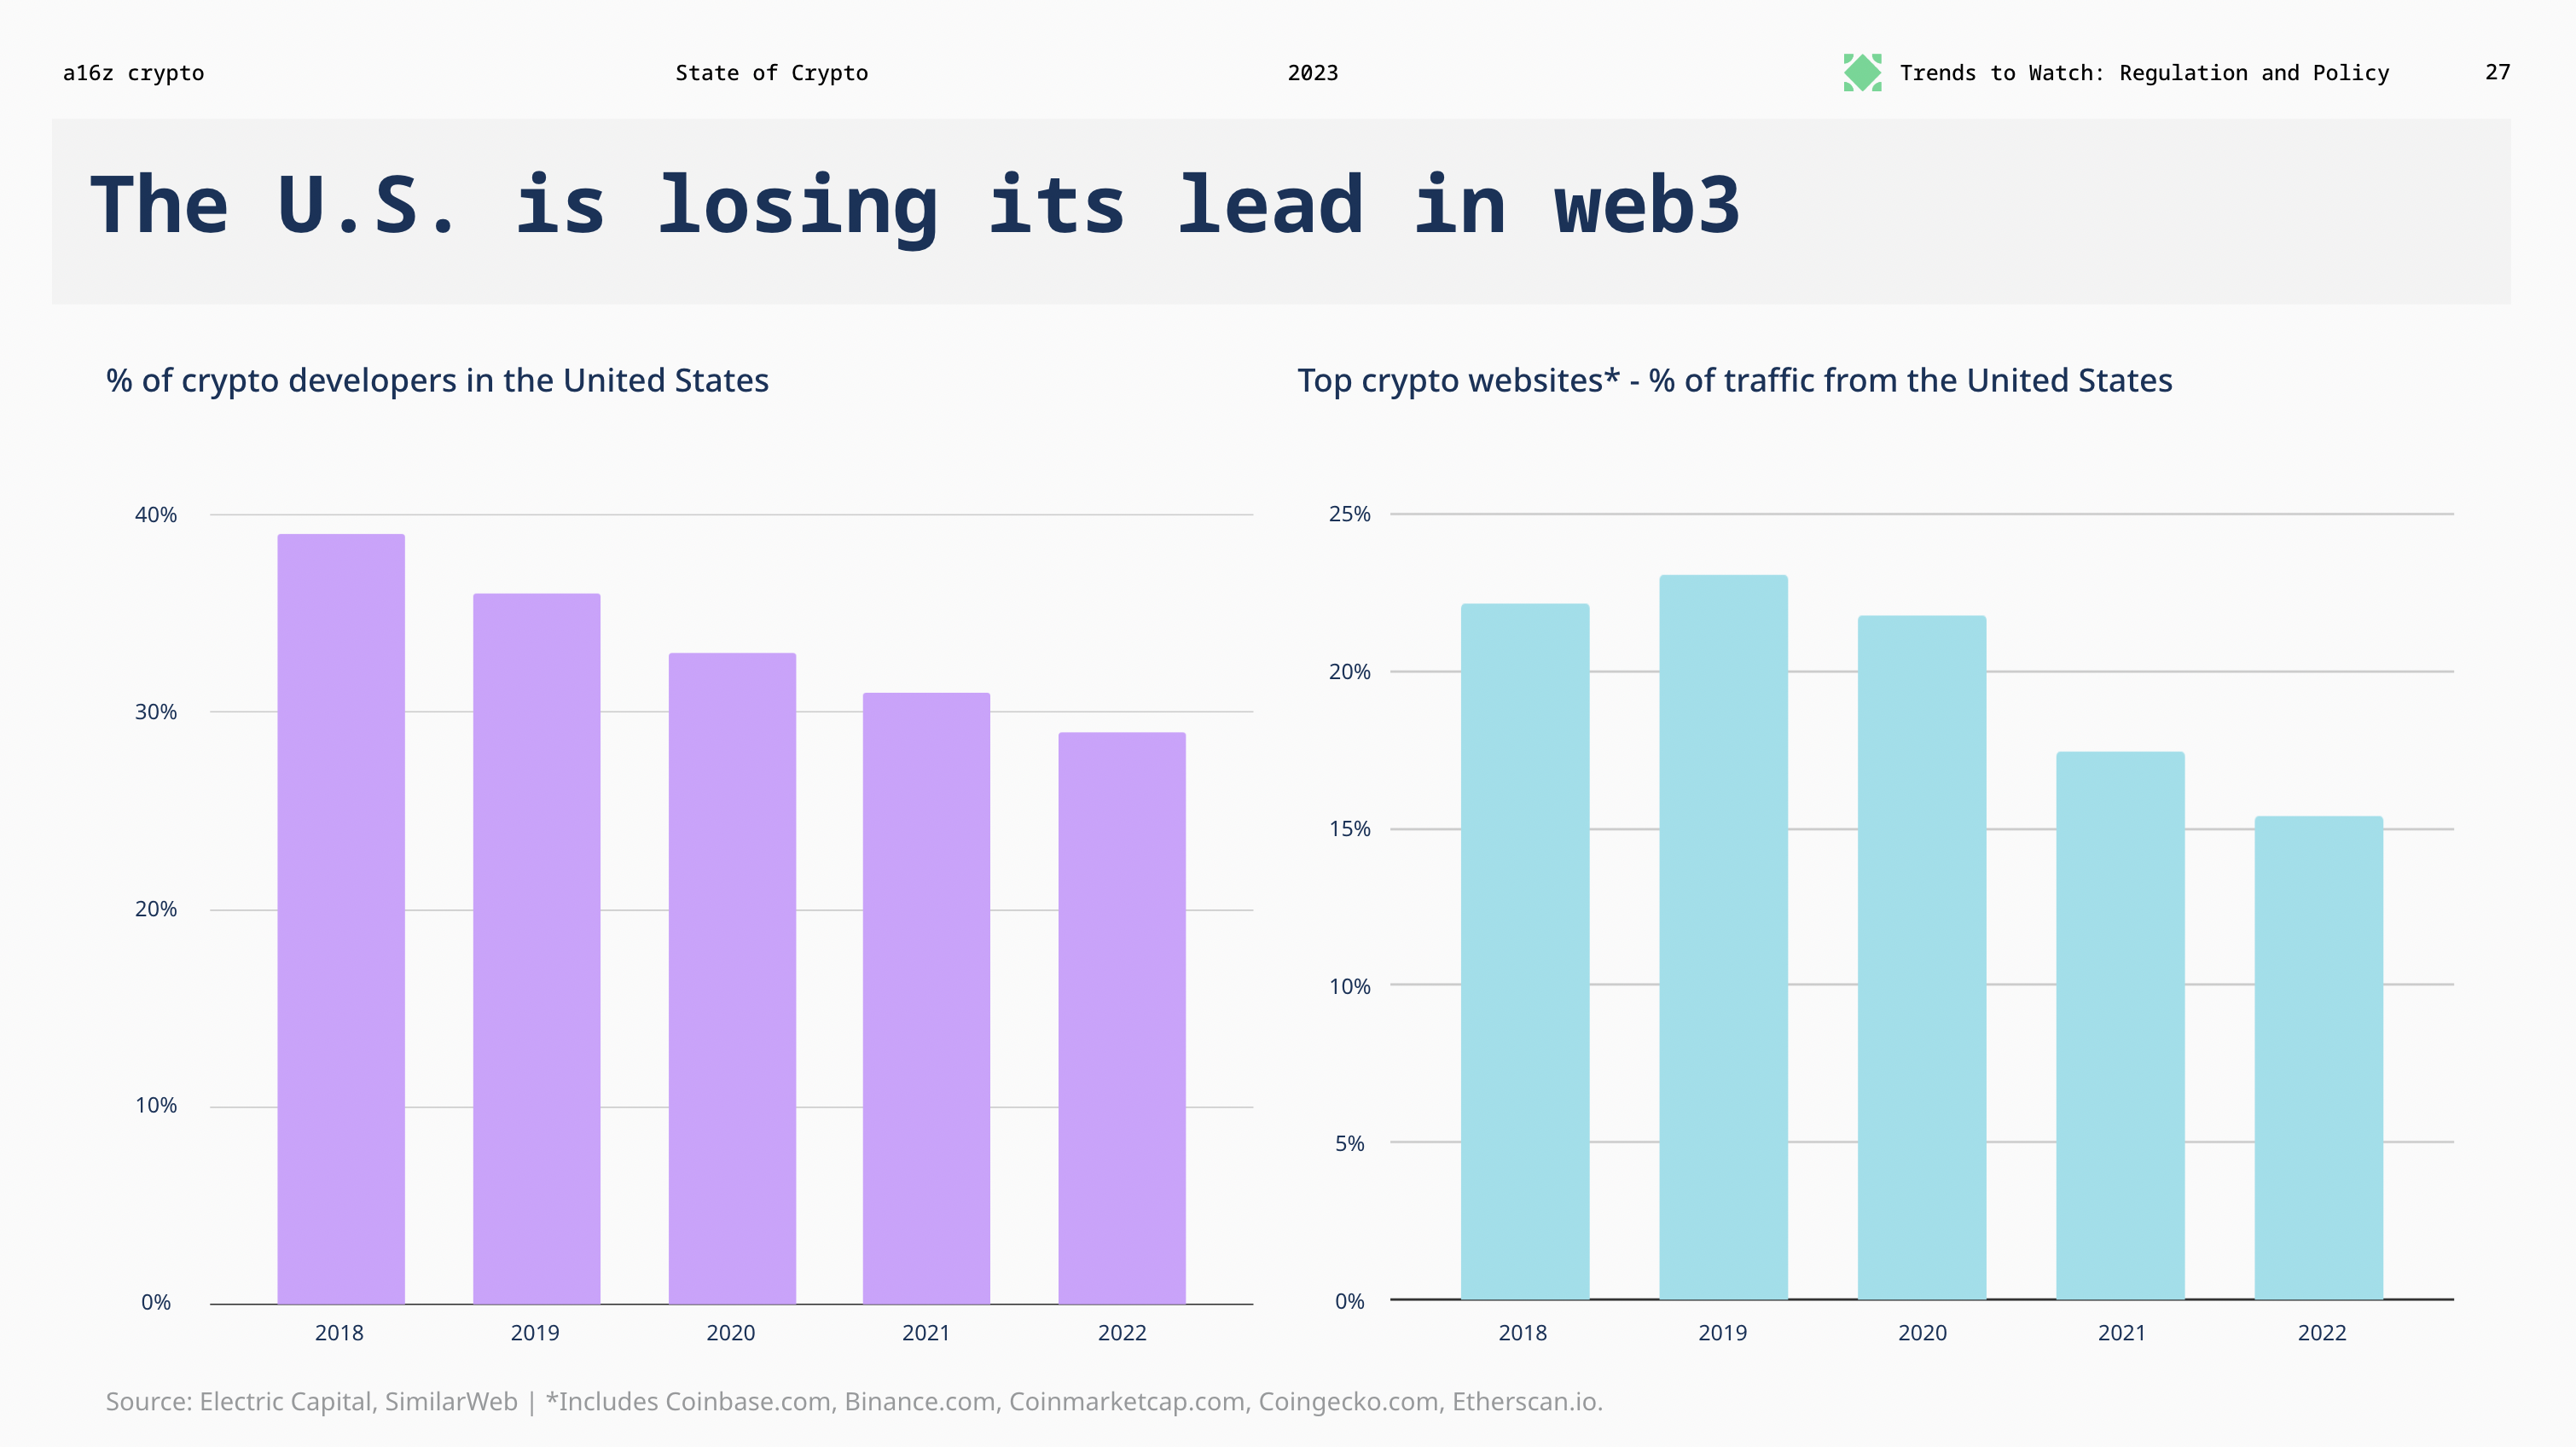
There are some positive signs, however – including a growing, bipartisan push for legislation that could provide much-needed clarity. We hope that this momentum will continue, and that policymakers will fight for the future and the potential of these technologies.
7. Zooming out shows progress
We’re still early in web3, but we’re no longer at the beginning. Stepping back from short-term volatility reveals a more predictable pattern: a steady product cycle that is distinctly different from the financial cycles that saturate media attention. 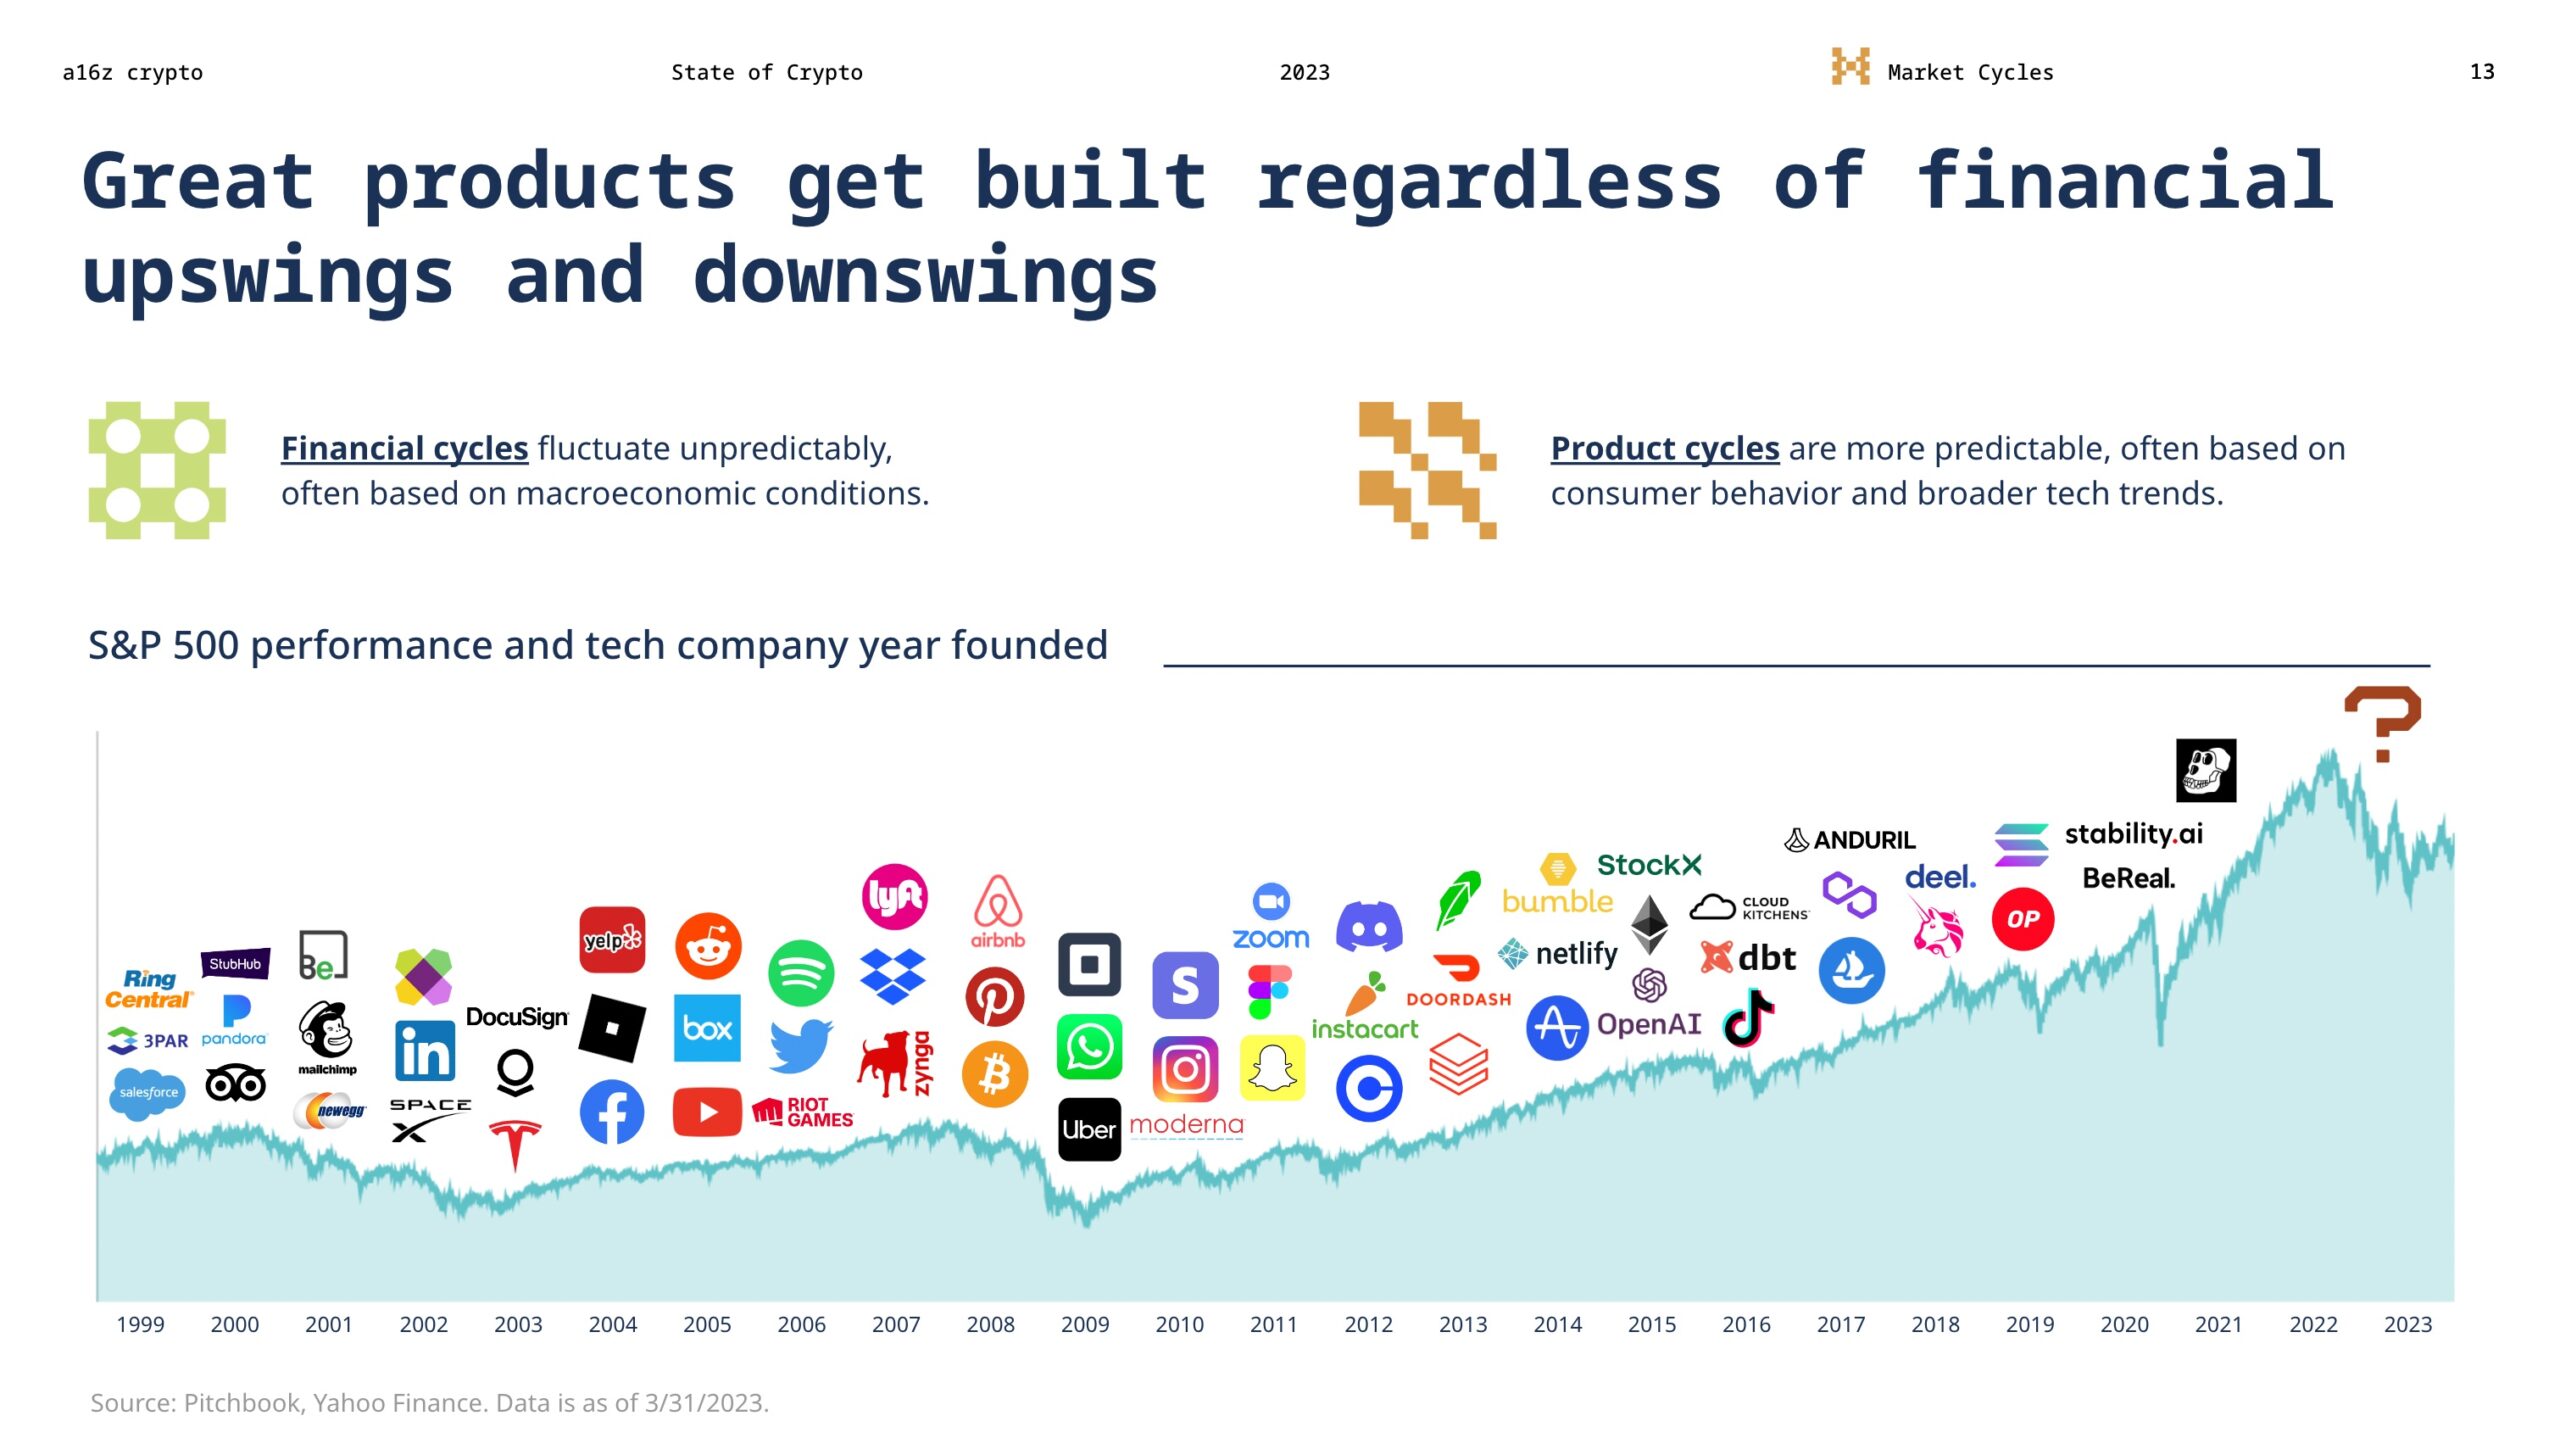
We’ve underscored the significance of the “price-innovation cycle” – the observation that prices and development activity are intertwined in a positive feedback loop – many times; it’s a useful mental model for navigating market cycles and understanding the indicators driving them. When crypto prices rise, more people get interested and join in. The attention, in turn, inspires (and funds) new ideas, startups, and projects, some of which lead to greater adoption in the long term.
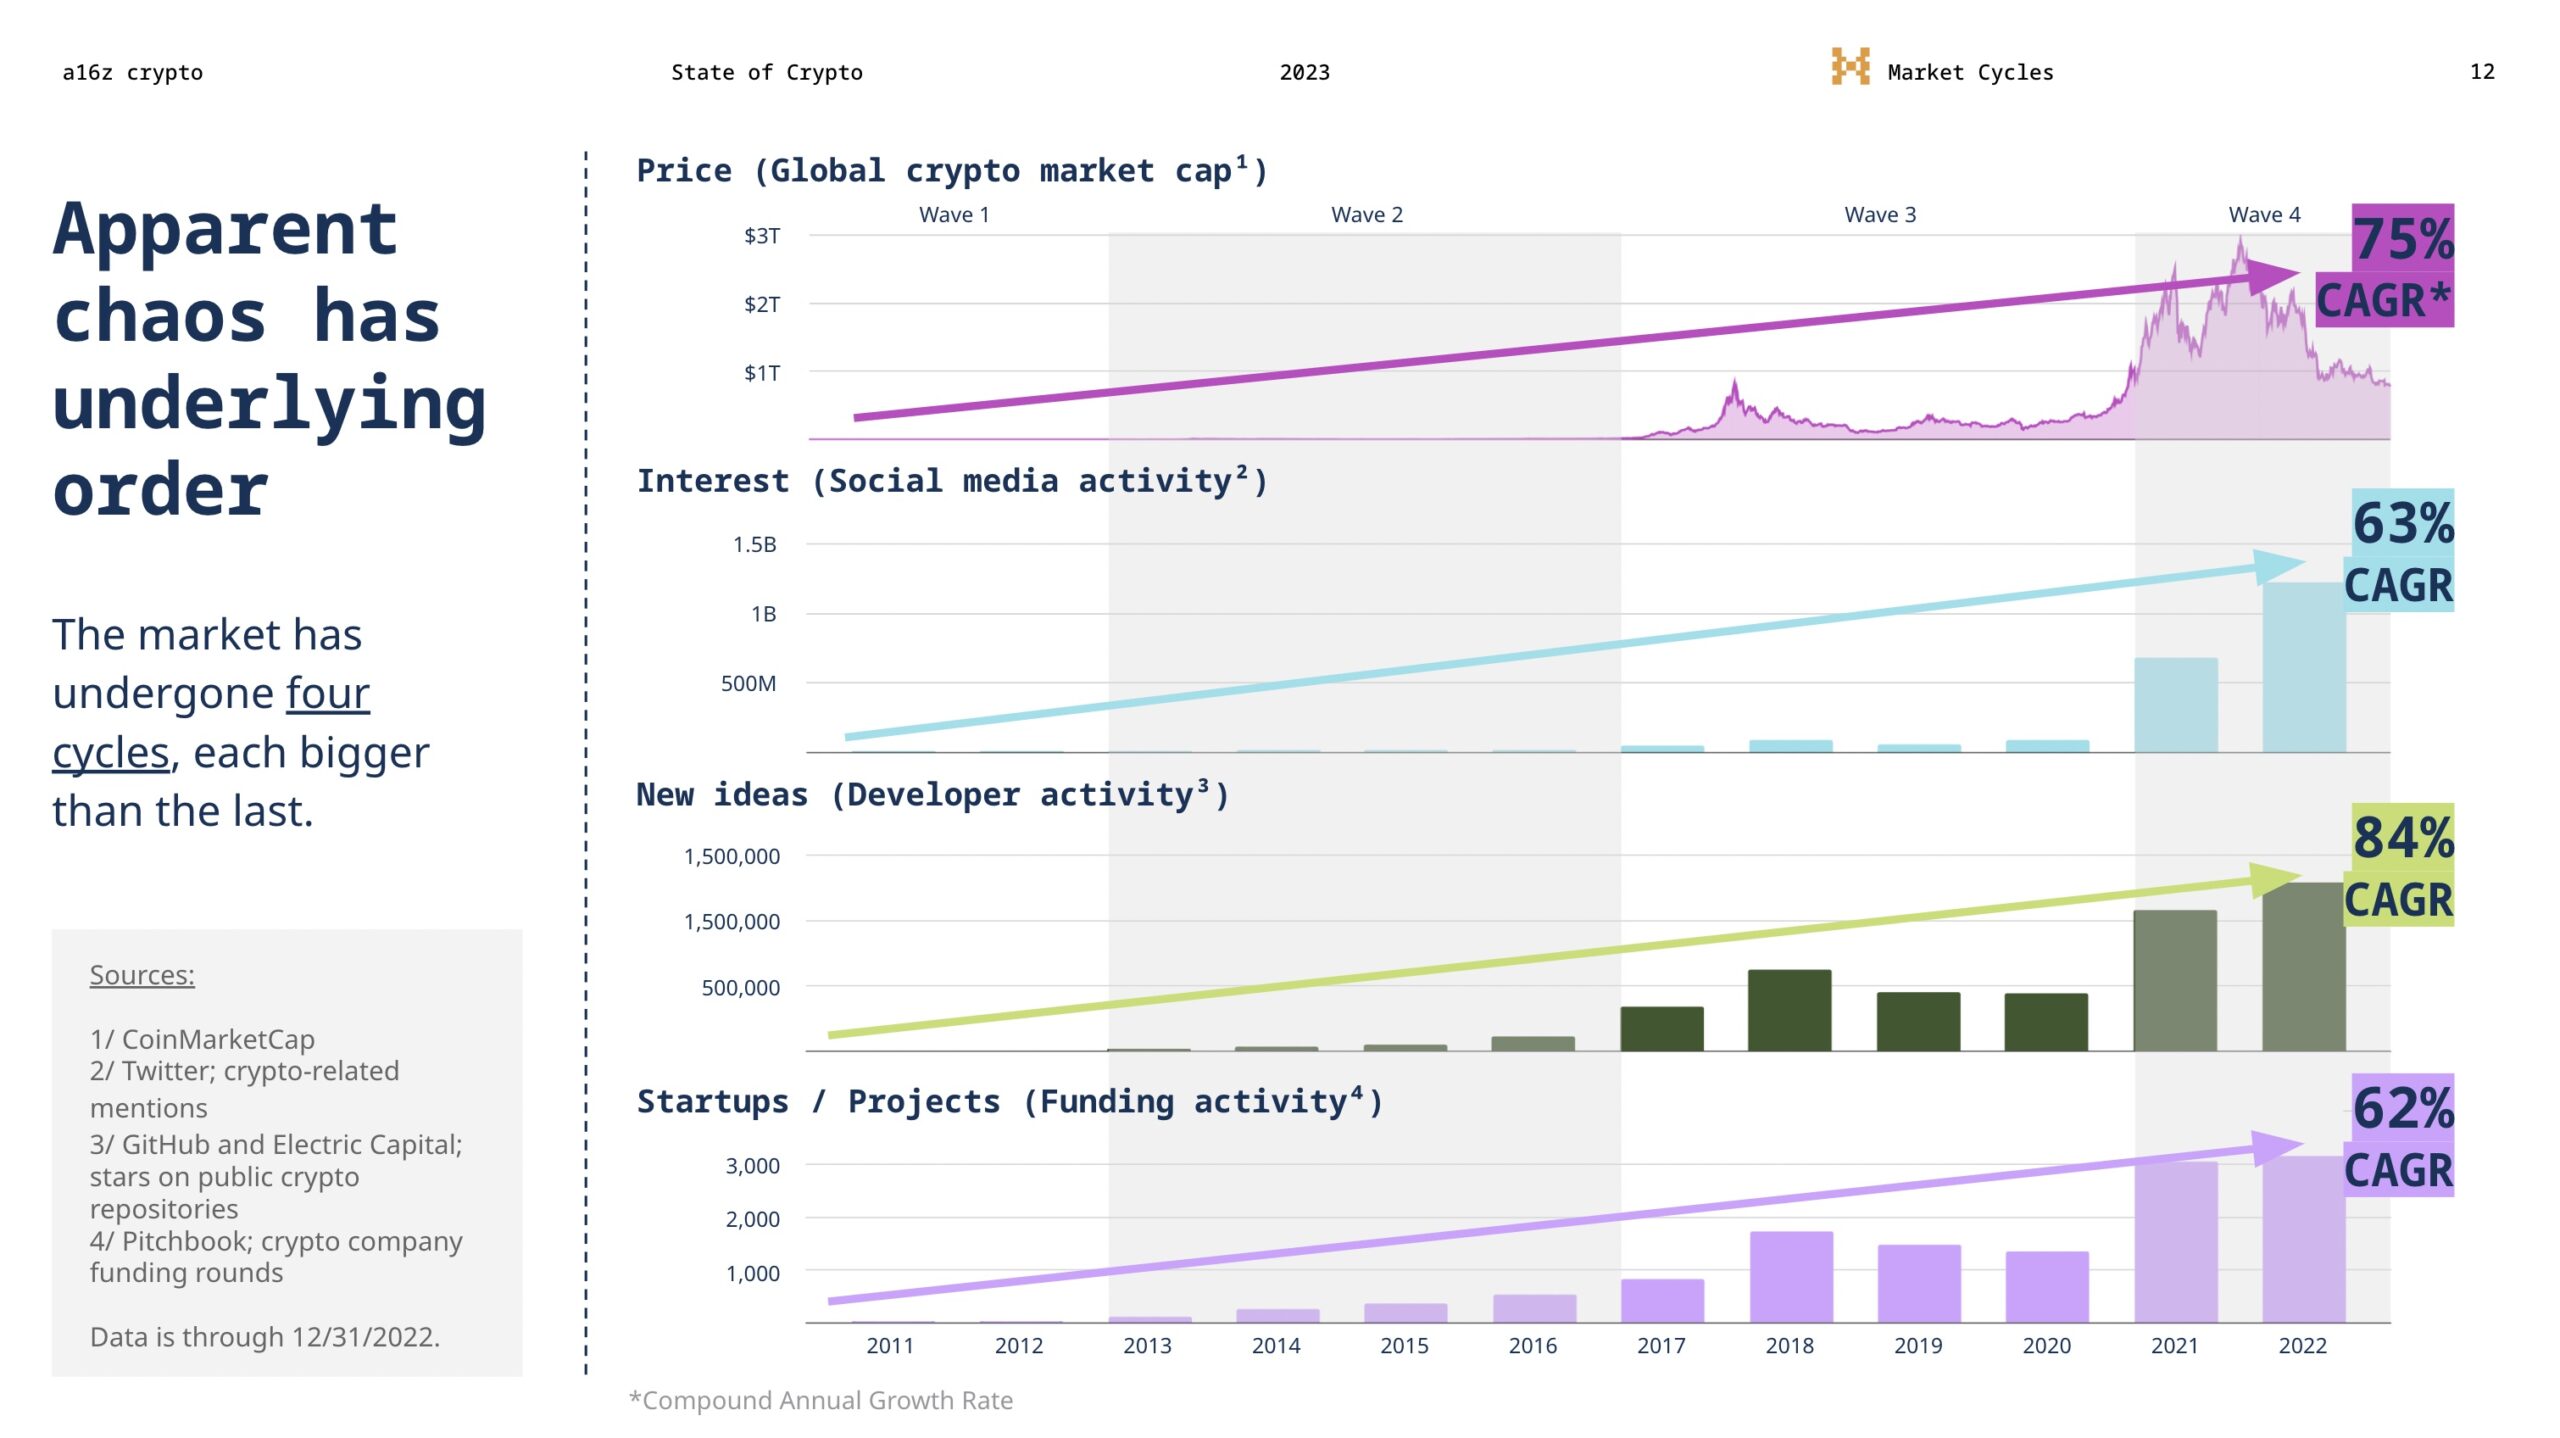 Over time, these cycles move the industry forward in technological waves. We may be in the middle of the fourth such cycle since Bitcoin’s inception in 2009. Taking a longer view suggests many indicators appear to be trending steadily upward.
This is why focusing on short-term market movements – and not enough on underlying technology trends – obscures the bigger picture. It’s also why we asked ourselves: What if there were a way to track durable progress along more meaningful dimensions than financials alone?
So we created the State of Crypto Index, a regularly updated and interactive index to track the industry’s growth.
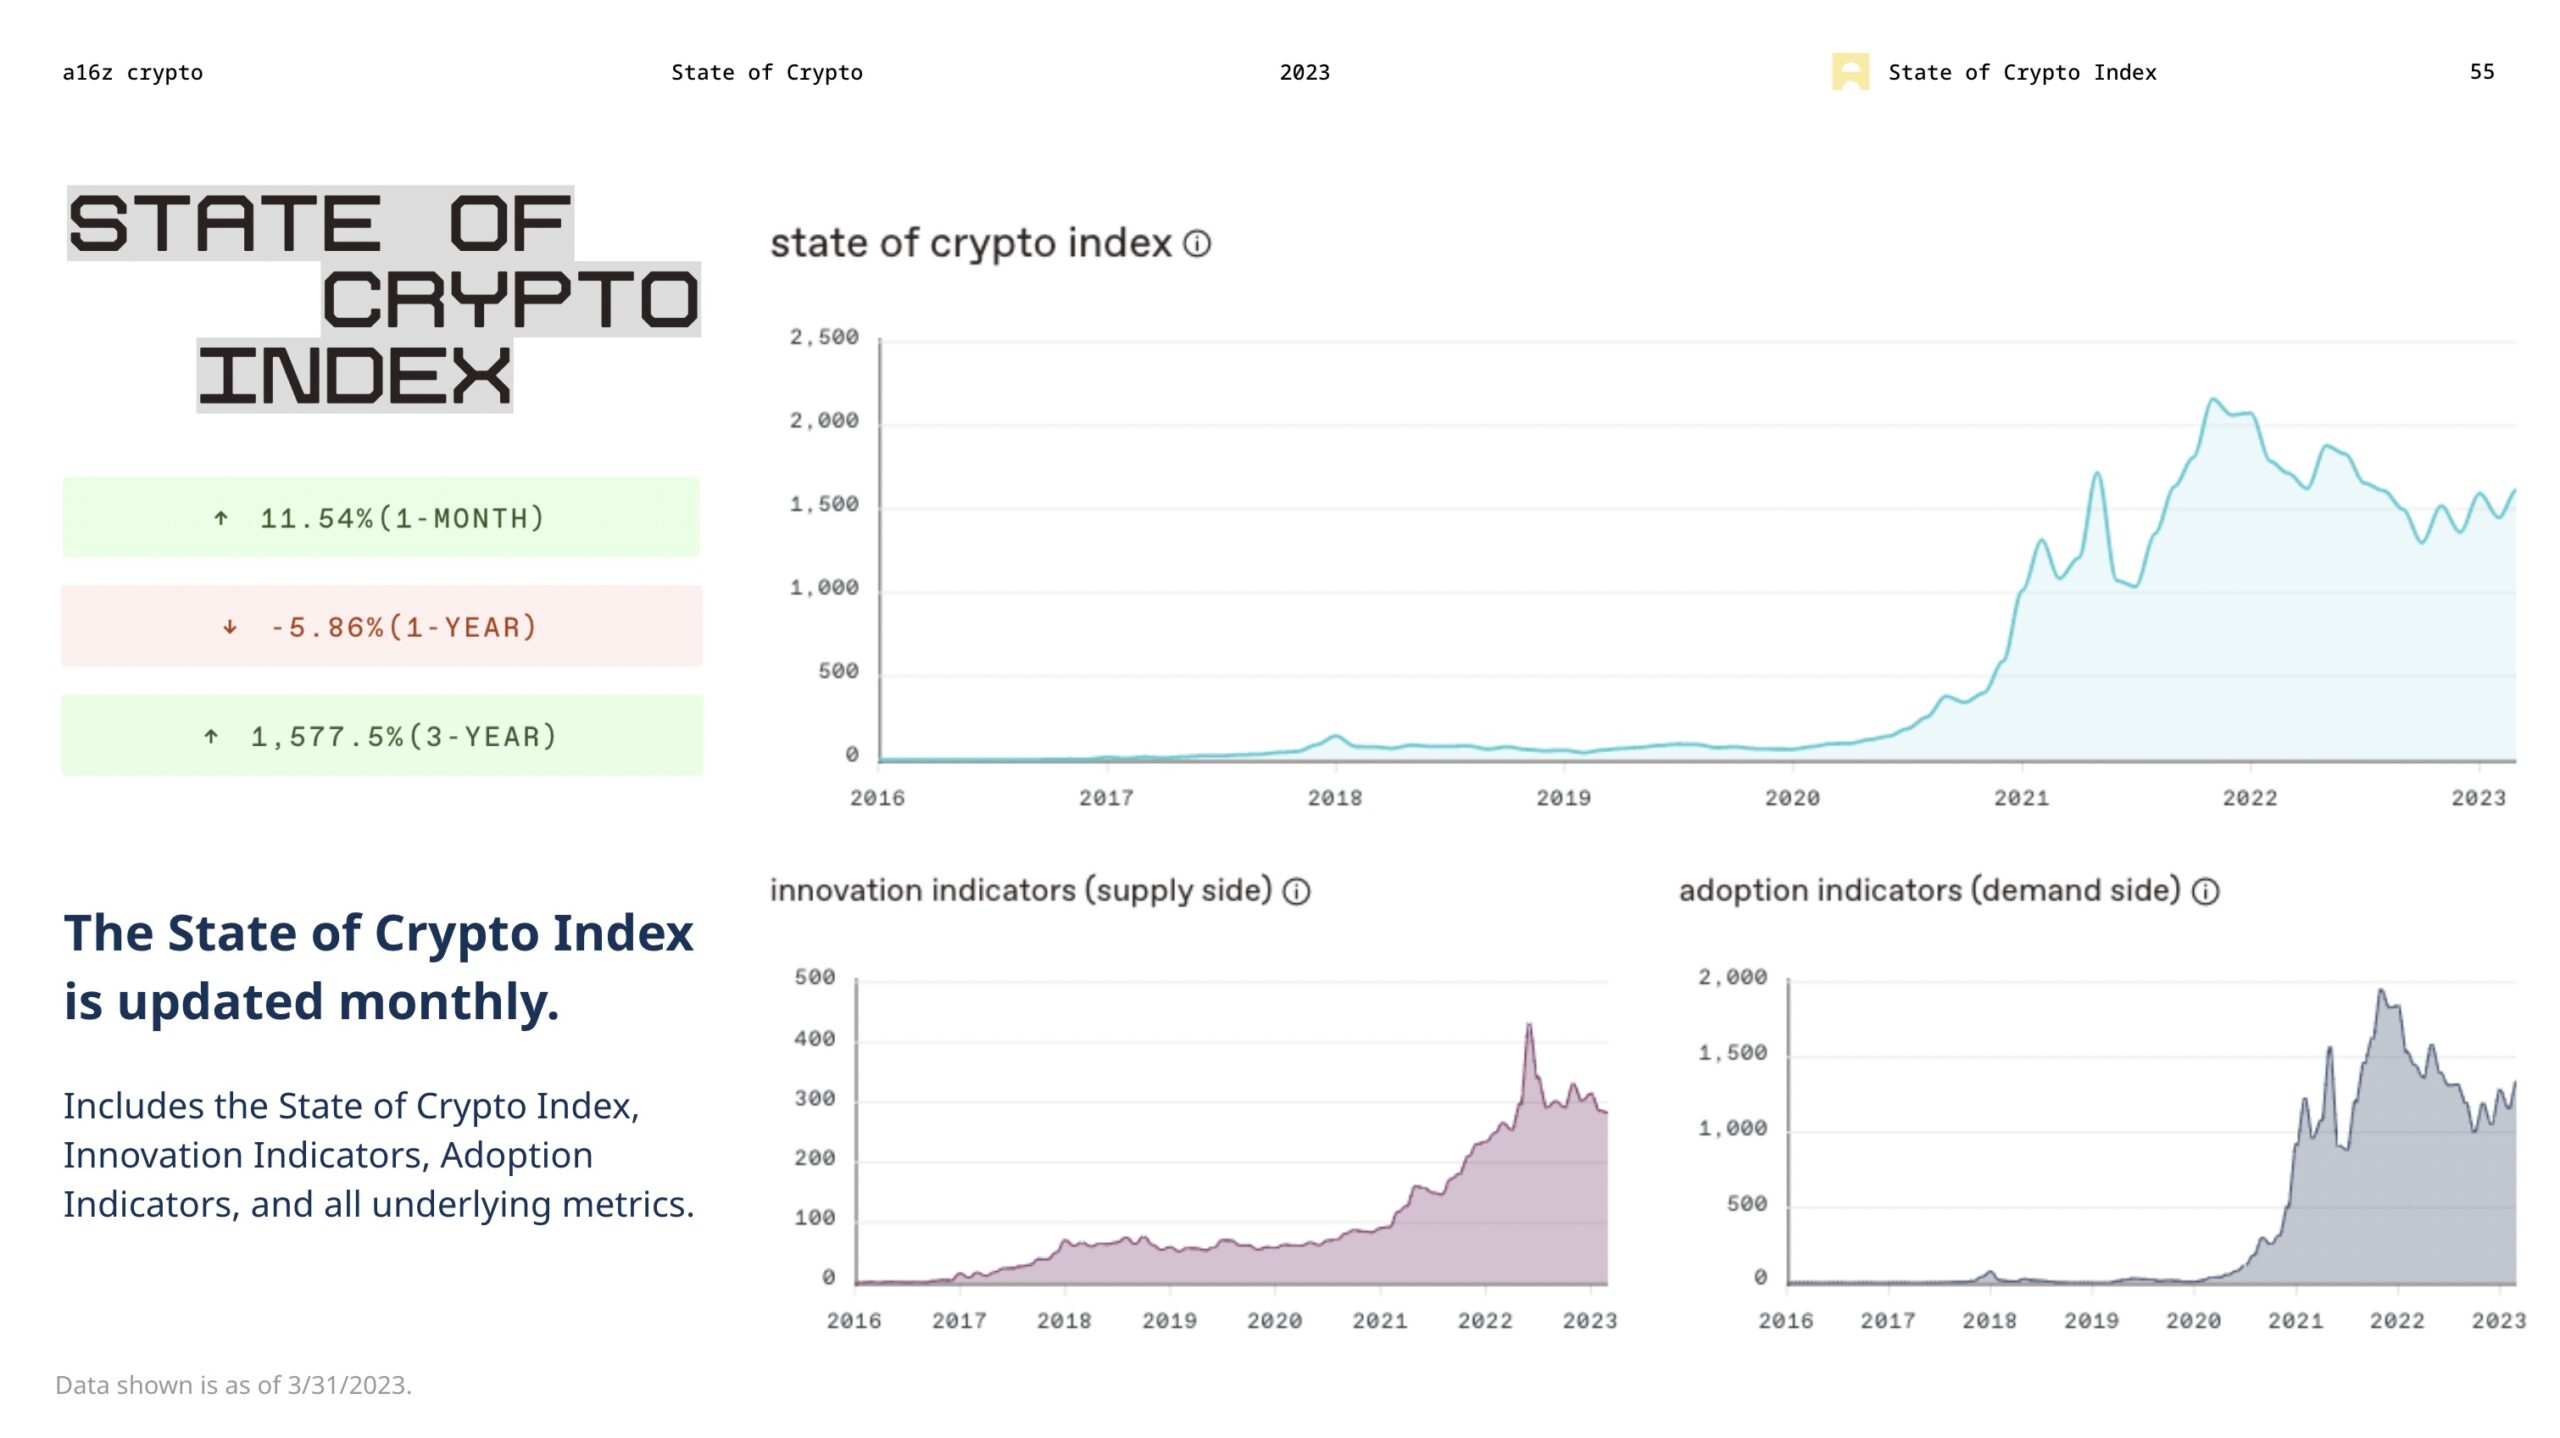
More specifically, the index shows the weighted average monthly growth among a set of key industry metrics. Alongside the index, you can view all the metrics – a collection of supply-side and demand-side measurements that serve as indicators of web3 innovation and adoption, respectively – and the assumptions under which they’re blended.
The default view presents just one interpretation of the underlying data, weighted according to our preferences. We will also continue to evolve the tool. But you can explore and adjust the parameters yourself right now. Be sure to share your findings with us at @a16zcrypto on Twitter, Farcaster, and elsewhere; we’ll highlight the most informative and interesting takes.
***
The views expressed here are those of the individual AH Capital Management, L.L.C. (“a16z”) personnel quoted and are not the views of a16z or its affiliates. Certain information contained in here has been obtained from third-party sources, including from portfolio companies of funds managed by a16z. While taken from sources believed to be reliable, a16z has not independently verified such information and makes no representations about the enduring accuracy of the information or its appropriateness for a given situation. In addition, this content may include third-party advertisements; a16z has not reviewed such advertisements and does not endorse any advertising content contained therein.
This content is provided for informational purposes only, and should not be relied upon as legal, business, investment, or tax advice. You should consult your own advisers as to those matters. References to any securities or digital assets are for illustrative purposes only, and do not constitute an investment recommendation or offer to provide investment advisory services. Furthermore, this content is not directed at nor intended for use by any investors or prospective investors, and may not under any circumstances be relied upon when making a decision to invest in any fund managed by a16z. (An offering to invest in an a16z fund will be made only by the private placement memorandum, subscription agreement, and other relevant documentation of any such fund and should be read in their entirety.) Any investments or portfolio companies mentioned, referred to, or described are not representative of all investments in vehicles managed by a16z, and there can be no assurance that the investments will be profitable or that other investments made in the future will have similar characteristics or results. A list of investments made by funds managed by Andreessen Horowitz (excluding investments for which the issuer has not provided permission for a16z to disclose publicly as well as unannounced investments in publicly traded digital assets) is available at https://a16z.com/investments/.
Charts and graphs provided within are for informational purposes solely and should not be relied upon when making any investment decision. Past performance is not indicative of future results. The content speaks only as of the date indicated. Any projections, estimates, forecasts, targets, prospects, and/or opinions expressed in these materials are subject to change without notice and may differ or be contrary to opinions expressed by others. Please see https://a16z.com/disclosures for additional important information.