Stablecoins spent years in search of a story.
At first they were a trading tool, a way to move dollars across exchanges. Then they became a savings vehicle, something to hold rather than spend. Now the data is pointing somewhere new: stablecoins are becoming core financial infrastructure.
Here are nine charts that show what’s driving the trend.
#1 Regulation accelerated market growth
For most of stablecoins’ history, regulatory uncertainty capped institutional participation. Then, regulatory clarity happened through the Genius Act. It didn’t create the trend, but it amplified it.
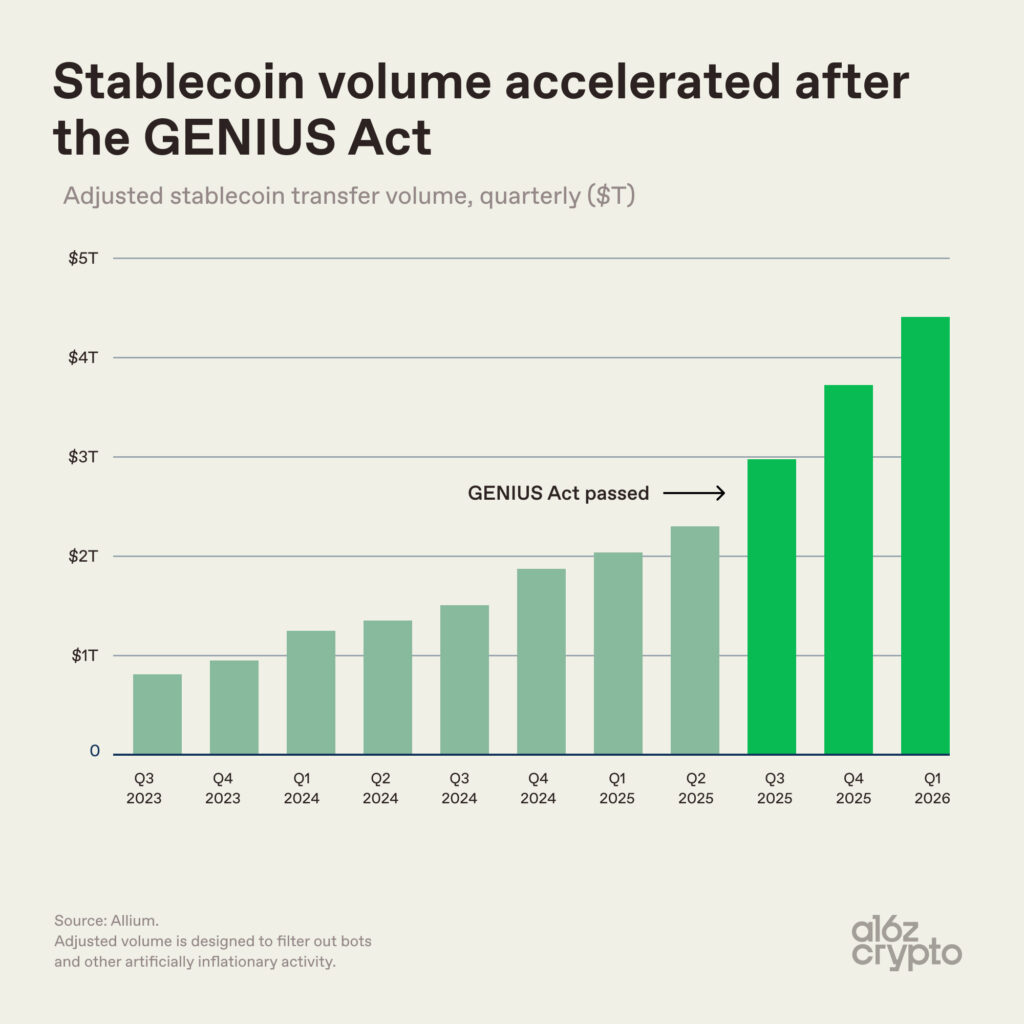
In the U.S., the GENIUS Act established the first federal framework for stablecoin issuance. The shift shows up in the data: Adjusted volume had already been rising for several quarters before the Act passed, but growth accelerated afterward — reaching roughly $4.5T in Q1 2026.
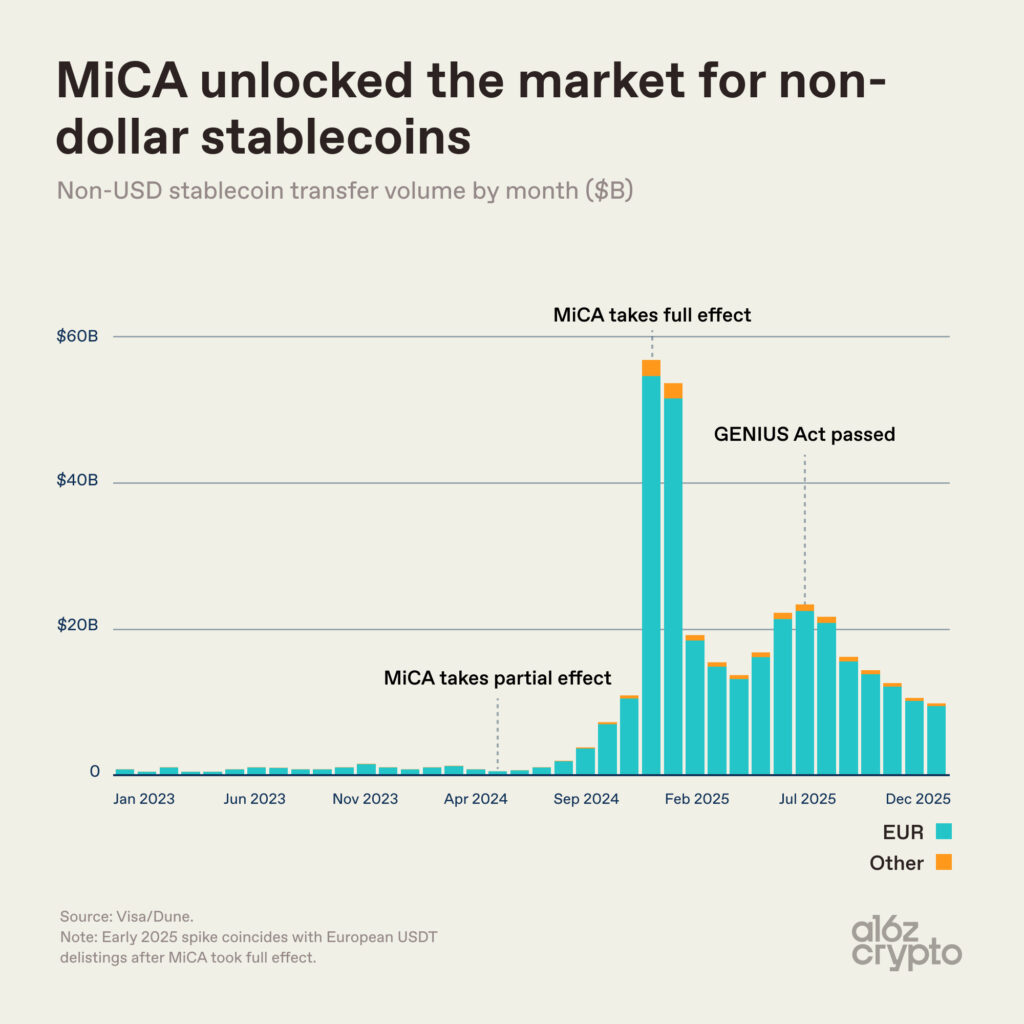
Europe’s stablecoin regulation – the Markets in Crypto-Assets (MiCA) framework — tells a more complicated story. When it took full effect at the end of 2024, several major exchanges delisted USDT to comply with the rules, resulting in a spike in non-USD stablecoin activity that briefly exceeded $40B.
Volume has since stabilized at a higher baseline than pre-MiCA, around $15–25B per month. Regulation created a persistent market for non-USD stablecoins where one barely existed before.
#2 Stablecoin commerce is growing
The most structurally significant shift may be in what people are actually doing with stablecoins.

C2C dwarfs every other category by raw transaction count: 789.5M in 2025. But consumer-to-business stablecoin transactions are growing the fastest, more than doubling (128%) year-over-year to 284.6M in 2025 from 124.9M in 2024.
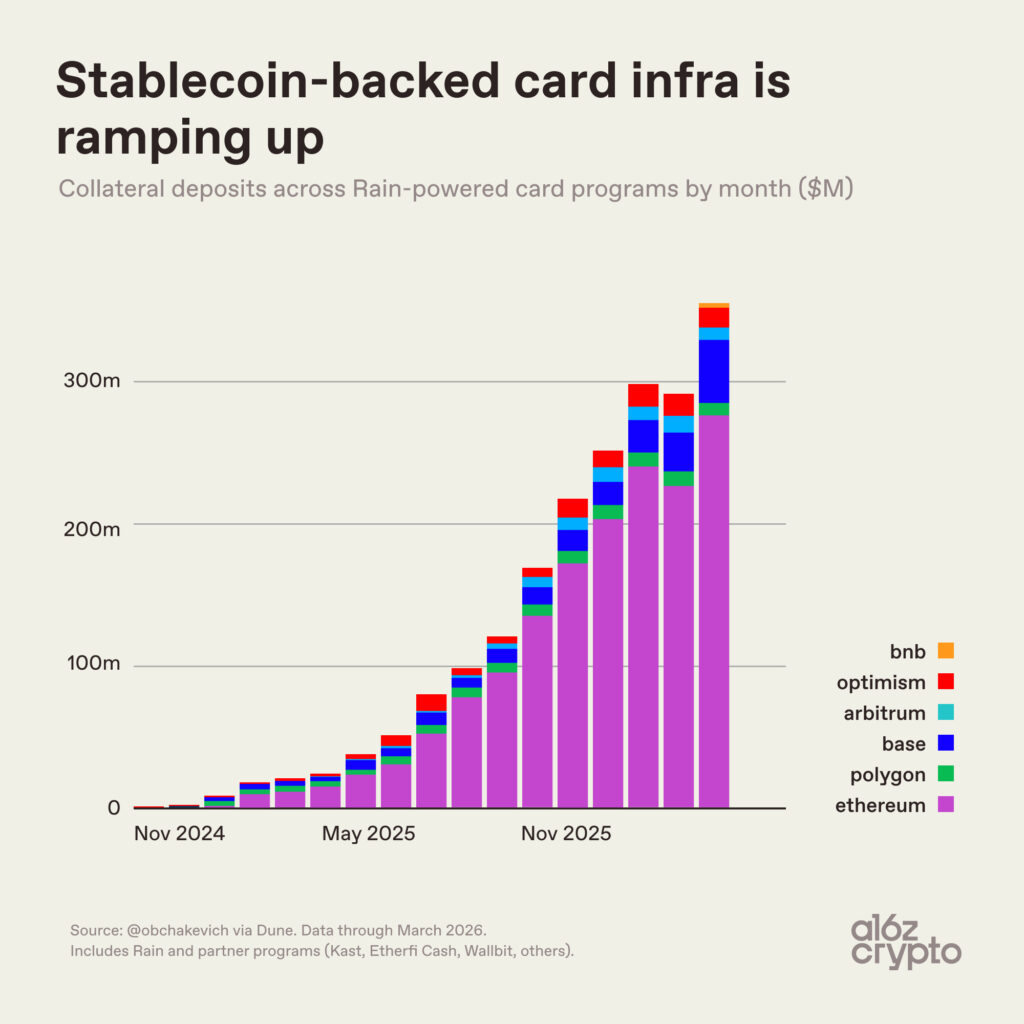
Stablecoin card infrastructure data underscores the trend.
Monthly collateral deposits across Rain-powered stablecoin card programs (including Etherfi Cash, Kast, Wallbit, and others) grew from near zero in November 2024 to over $300M/month by early 2026. Though this is collateral backing card spend, not direct stablecoin spend itself, the trajectory is striking: Stablecoin commerce is on the rise.
#3 Stablecoin velocity is picking up
Each dollar of stablecoin supply is turning over more frequently.
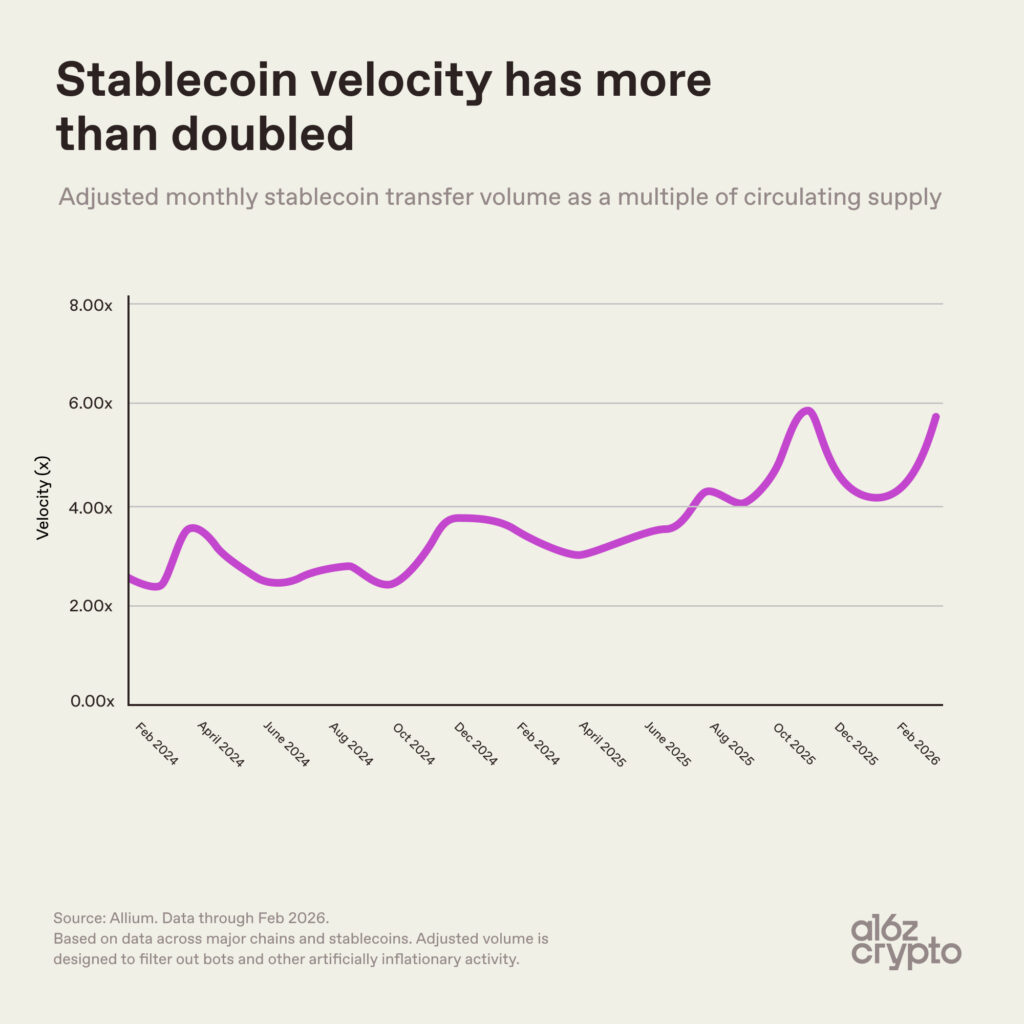
Since early 2024, stablecoin velocity — adjusted monthly transfer volume relative to circulating supply — has roughly doubled, climbing from 2.6x to 6x. A rising velocity means demand for stablecoin transactions is outpacing new issuance, so existing supply is working harder.
That’s a sign of a real payments network, one where the underlying currency is being used, not just held.
#4 Stablecoin volumes are reflecting more payments
When you strip out things like trading, treasury flows, and exchange mechanics — the bulk of stablecoin transactions — you’re left with an estimated $350–550B in payments between different parties last year.

The business-to-business segment dominates stablecoin payments by volume (unsurprisingly, given the scale). But other segments, like direct consumer-to-consumer, are expanding rapidly — as are payments to and from merchants.
#5 Stablecoin payments are currently concentrated in particular regions
Geographically, stablecoin payments activity isn’t evenly distributed.
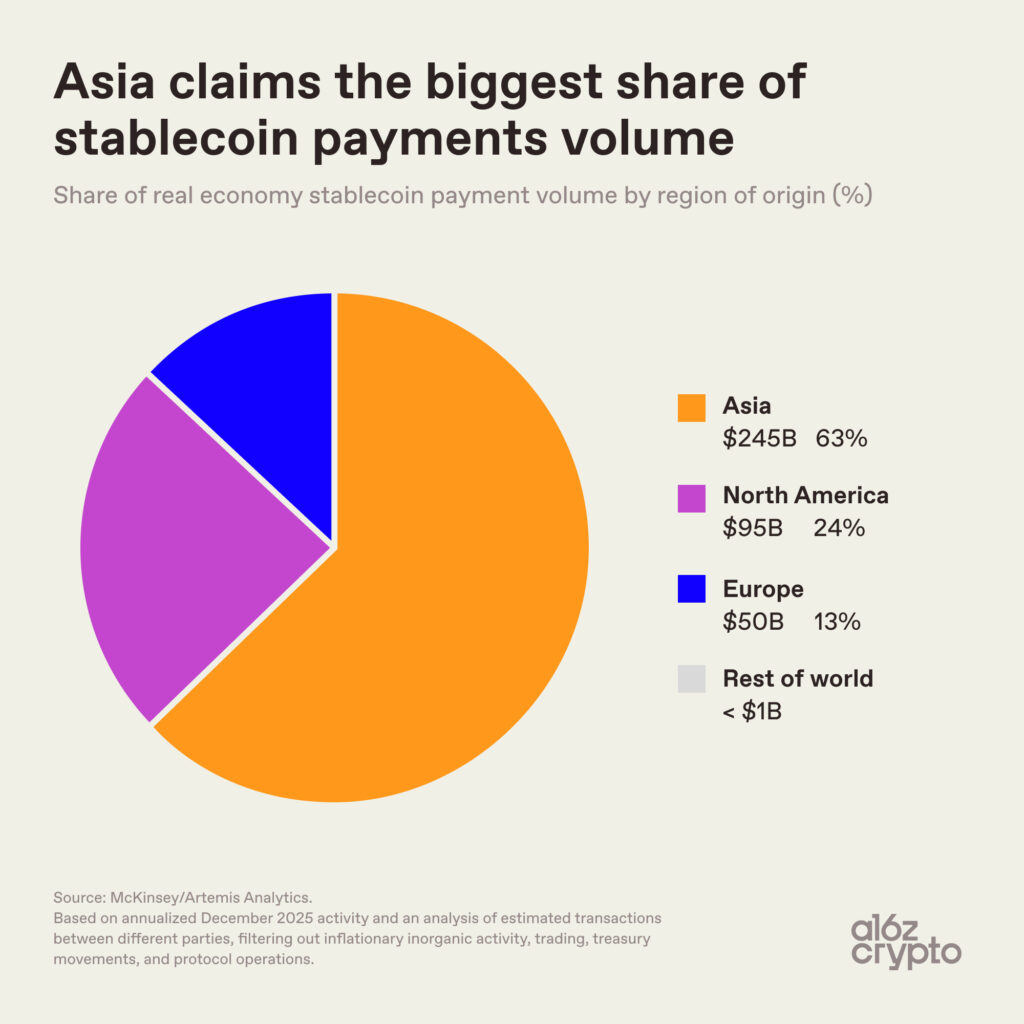
Nearly two-thirds of the volume originates from Asia, primarily Singapore, Hong Kong, and Japan.
North America accounts for roughly a quarter. Europe, meanwhile, is about 13%. Latin America and Africa together represent just a sliver at less than $1B.
#6 It’s not just cross-border payments — it’s local currencies, global rails
The non-USD story isn’t just European. It’s showing up in emerging markets too, and for different reasons.
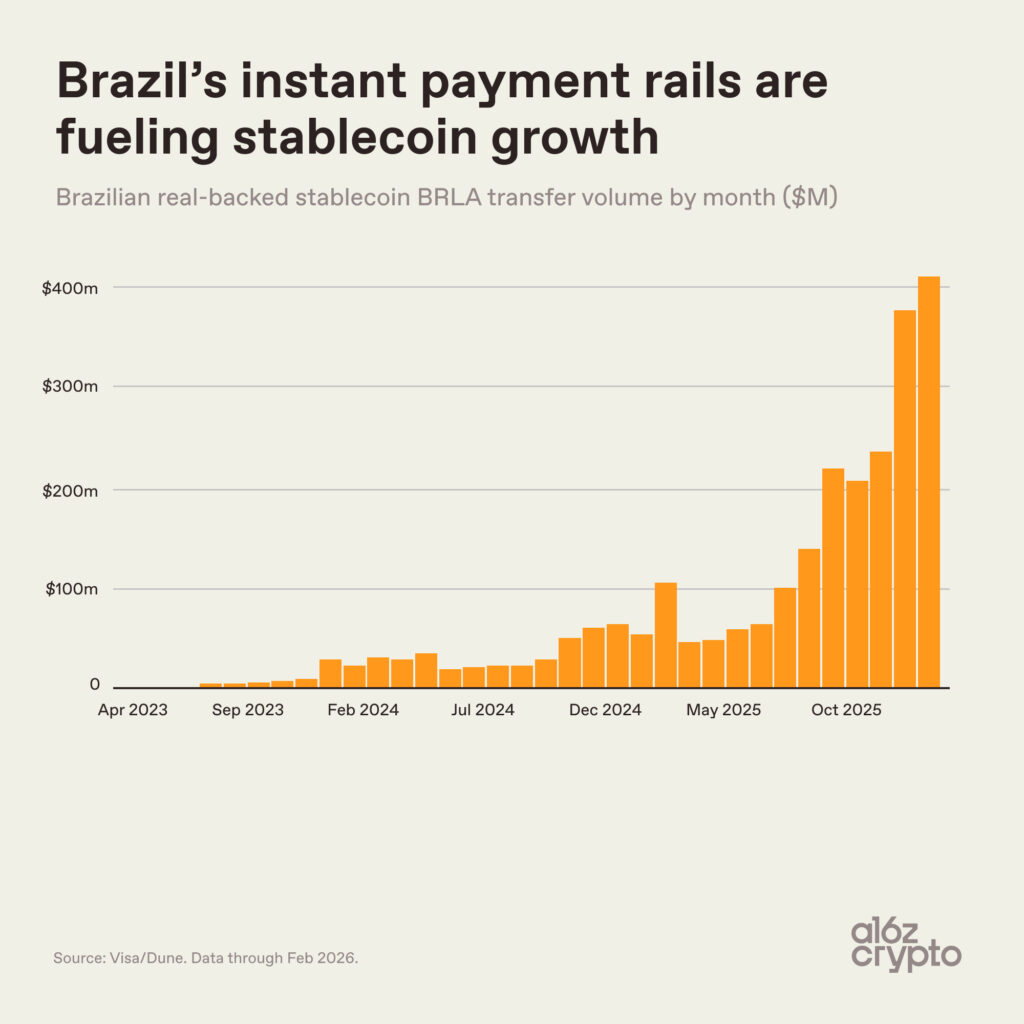
Brazil is a clear example. Monthly transfer volume in BRLA — a Brazilian real-backed stablecoin — has grown from near zero in early 2023 to roughly $400M/month by early 2026. Integration with Brazil’s instant payments network PIX has helped drive adoption.
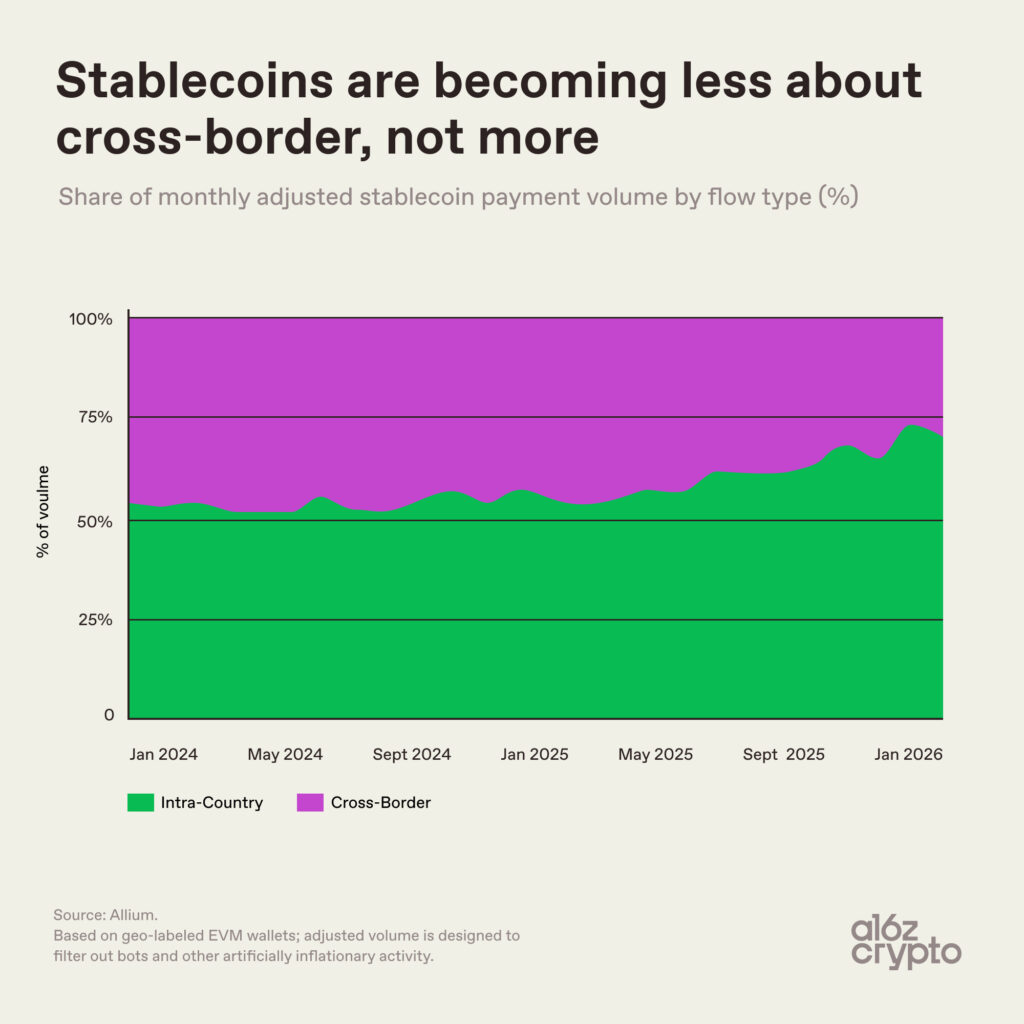
Though stablecoins are often widely described as a cross-border tool, the share of cross-border activity has actually been falling, not rising.
Intra-country transactions have grown from roughly half of payment volume in early 2024 to nearly three-quarters by early 2026. The implication? Stablecoins are finding their footing not just as a remittance or FX tool, but as a local payments medium that happens to run on global infrastructure.
***
Put it all together and a coherent picture emerges, though it’s not the one most people expected: Many people thought stablecoins would be all about cross-border transactions. Instead, they’re becoming more local. And while the U.S. dollar dominates today as the fiat currency backing the vast majority of stablecoins, stablecoins are not purely dollar exports. Non-USD variants like euro-backed and Brazilian-real backed local currency stablecoins are gaining ground.
And while peer-to-peer stablecoin transfers far outnumber other types of payment flows, increasingly more usage is going to everyday commerce.
Each quarter adds more evidence that stablecoins are developing into general-purpose payment infrastructure. They’re global by design, yet increasingly local in practice.
It’s still early. But the shape of the system is becoming clearer.
***
Acknowledgements: Thanks to Daren Matsuoka for the first chart, and to Noah Levine and Scott Duke Kominers for helpful feedback and pointing to data sources used in a couple others.
***
Robert Hackett is features editor and head of special projects at a16z crypto.
Jeremy Zhang is an engineering partner at a16z crypto.
***
The views expressed here are those of the individual AH Capital Management, L.L.C. (“a16z”) personnel quoted and are not the views of a16z or its affiliates. Certain information contained in here has been obtained from third-party sources, including from portfolio companies of funds managed by a16z. While taken from sources believed to be reliable, a16z has not independently verified such information and makes no representations about the current or enduring accuracy of the information or its appropriateness for a given situation. In addition, this content may include third-party advertisements; a16z has not reviewed such advertisements and does not endorse any advertising content contained therein.
You should consult your own advisers as to those matters. References to any securities or digital assets are for illustrative purposes only, and do not constitute an investment recommendation or offer to provide investment advisory services. Furthermore, this content is not directed at nor intended for use by any investors or prospective investors, and may not under any circumstances be relied upon when making a decision to invest in any fund managed by a16z. (An offering to invest in an a16z fund will be made only by the private placement memorandum, subscription agreement, and other relevant documentation of any such fund and should be read in their entirety.) Any investments or portfolio companies mentioned, referred to, or described are not representative of all investments in vehicles managed by a16z, and there can be no assurance that the investments will be profitable or that other investments made in the future will have similar characteristics or results. A list of investments made by funds managed by Andreessen Horowitz (excluding investments for which the issuer has not provided permission for a16z to disclose publicly as well as unannounced investments in publicly traded digital assets) is available at https://a16z.com/investment-list/.
The content speaks only as of the date indicated. Any projections, estimates, forecasts, targets, prospects, and/or opinions expressed in these materials are subject to change without notice and may differ or be contrary to opinions expressed by others. Please see https://a16z.com/disclosures/ for additional important information.